- USD/INR witnessed a turnaround from a four-month-old descending trend-line resistance.
- Positive oscillators on the daily chart support prospects for the emergence of dip-buying.
- A sustained move beyond the 74.00-74.10 area is needed to confirm a bullish breakout.
The USD/INR pair came under some heavy selling pressure on Tuesday and moved away from near one-month tops set in the previous session. The pair faced rejection near a resistance marked by a four-month-old descending trend-line and for now, seems to have stalled its upward trajectory witnessed over the past two weeks or so.
The USD/INR pair has now retreated to the 23.6% Fibonacci level of the 76.52-72.76 recent fall. Meanwhile, technical indicators on the daily chart are holding in the bullish territory and support prospects for the emergence of some dip-buying at lower levels, warranting caution for aggressive bearish traders.
Hence, any subsequent slide might still be seen as an opportunity to initiate fresh bullish positions. and remain limited near the 73.25 horizontal support. That said, some follow-through selling might drag the USD/INR pair back below the 73.00 mark, towards retesting the recent swing lows, around the 72.75 region.
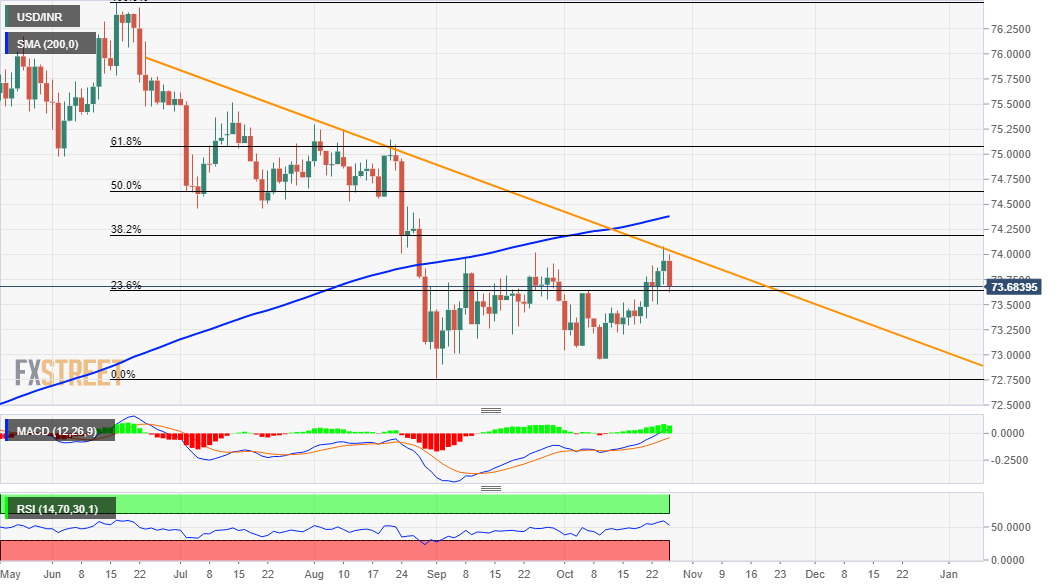
On the flip side, the 74.00-74.10 region (descending trend-line) might continue to act as a stiff resistance. This is closely followed by 38.2% Fibo. level, around the 74.20 region, and the very important 200-day SMA, near the 74.35-40 zone. A sustained move beyond should pave the way for additional near-term gains.
The USD/INR pair might then aim to surpass an intermediate resistance near the 74.65 region (50% Fibo. level) before eventually climbing to the key 75.00 psychological mark. The latter coincides with the 61.8% Fibo. level and might keep a lid on any further gains for the pair, at least for the time being.
USD/INR daily chart
Technical levels to watch
