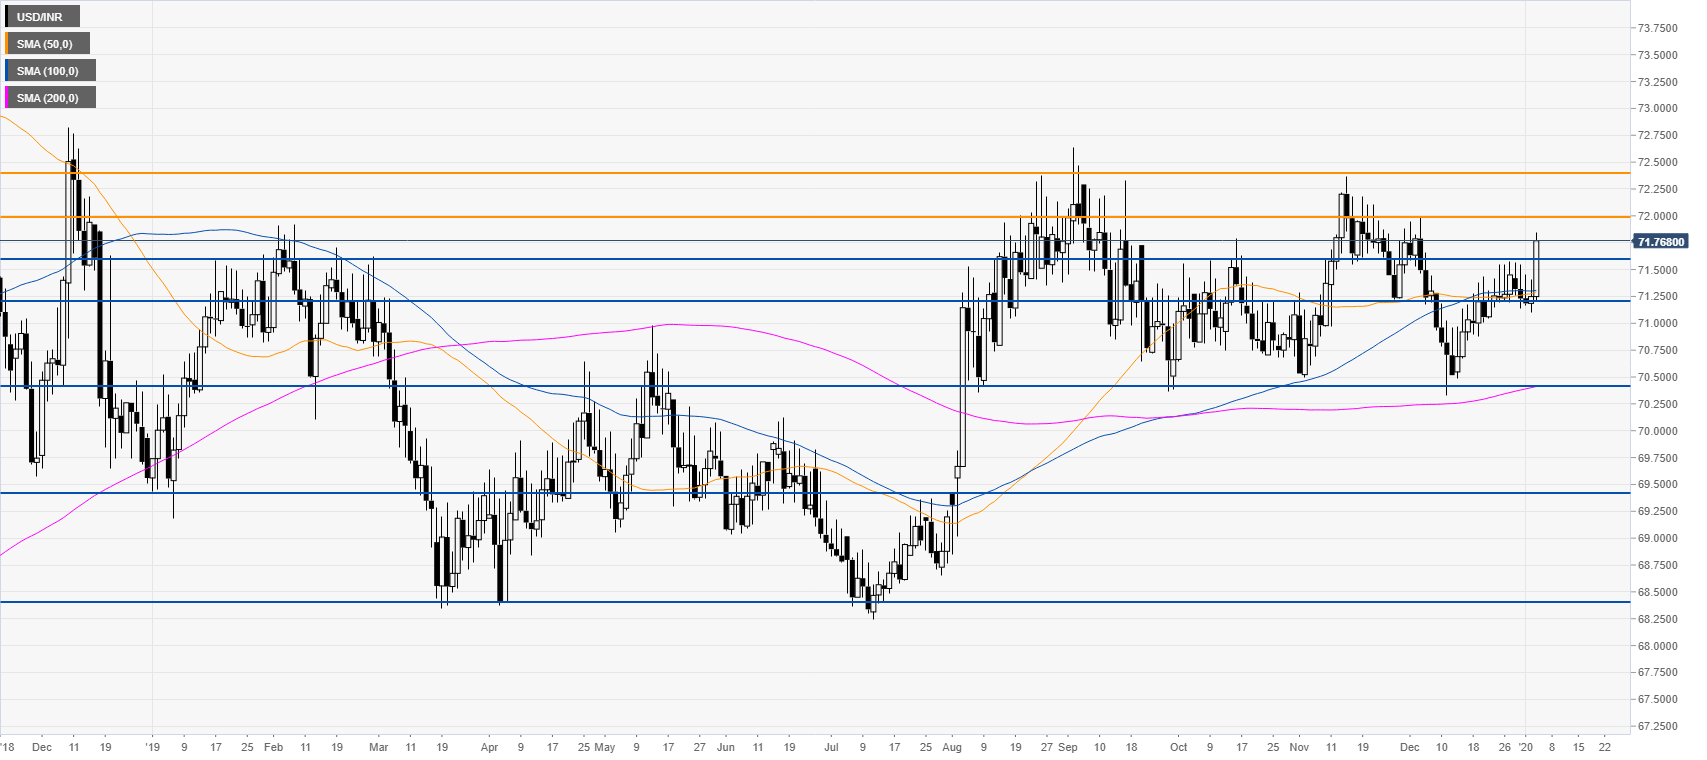
- USD/INR bulls are looking at the December highs.
- The level to beat for buyers is the 72.00 resistance.
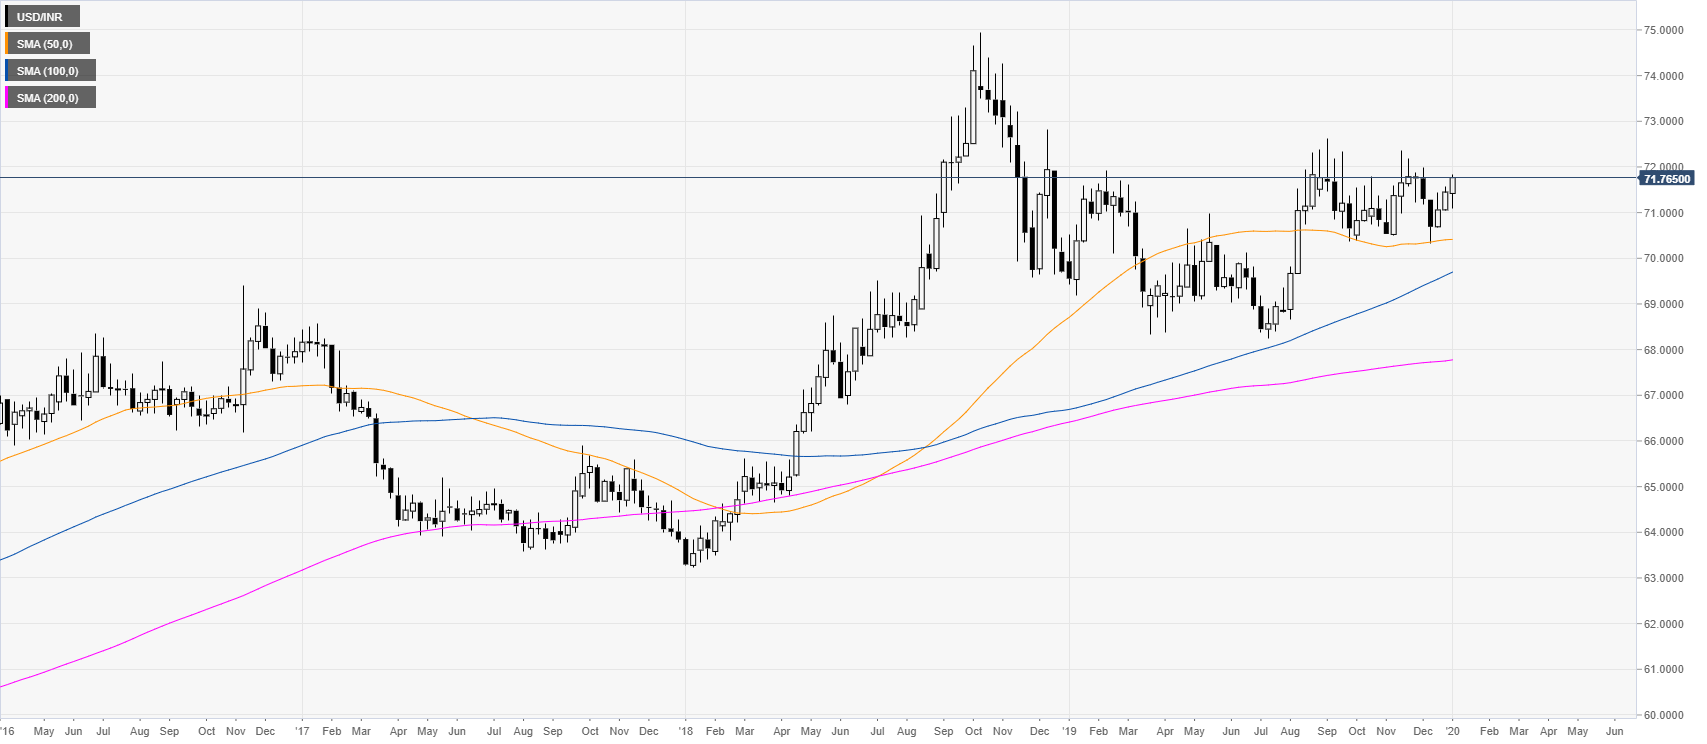
USD/INR weekly chart
In the second half of 2019, USD/INR has been consolidating the 2018 bull run in a bull flag while above the main weekly simple moving averages.
USD/INR daily chart
In the second part of December, the spot formed a bear flag below the 71.60 resistance. However, the bulls broke to the upside above the 71.60 level and the main SMAs. As the bulls are in control, the market is probably going to rise towards the 72.00 and 72.40 level. Support is seen at the 71.60 level. However, if bears break 71.20 support, the market can turn bearish towards the 70.40 level.
Additional key levels
