- USD/INR’s rectangle formation remains intact.
- The level to beat for buyers is the 71.60 resistance.
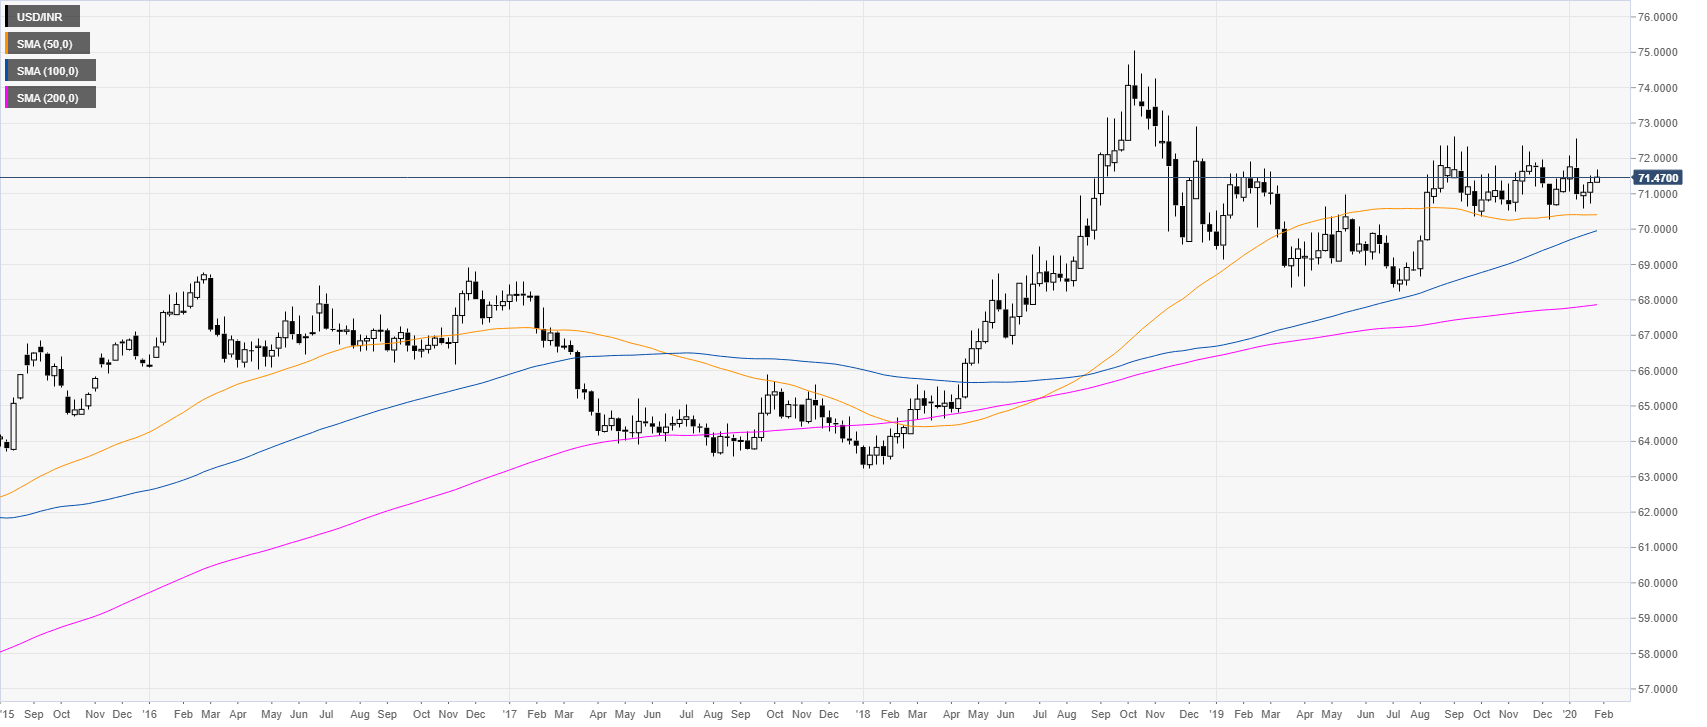
USD/INR weekly chart
USD/INR is trading in a rectangle consolidation after the 2018 bull market. The market is now holding above its main weekly simple moving averages (SMAs).
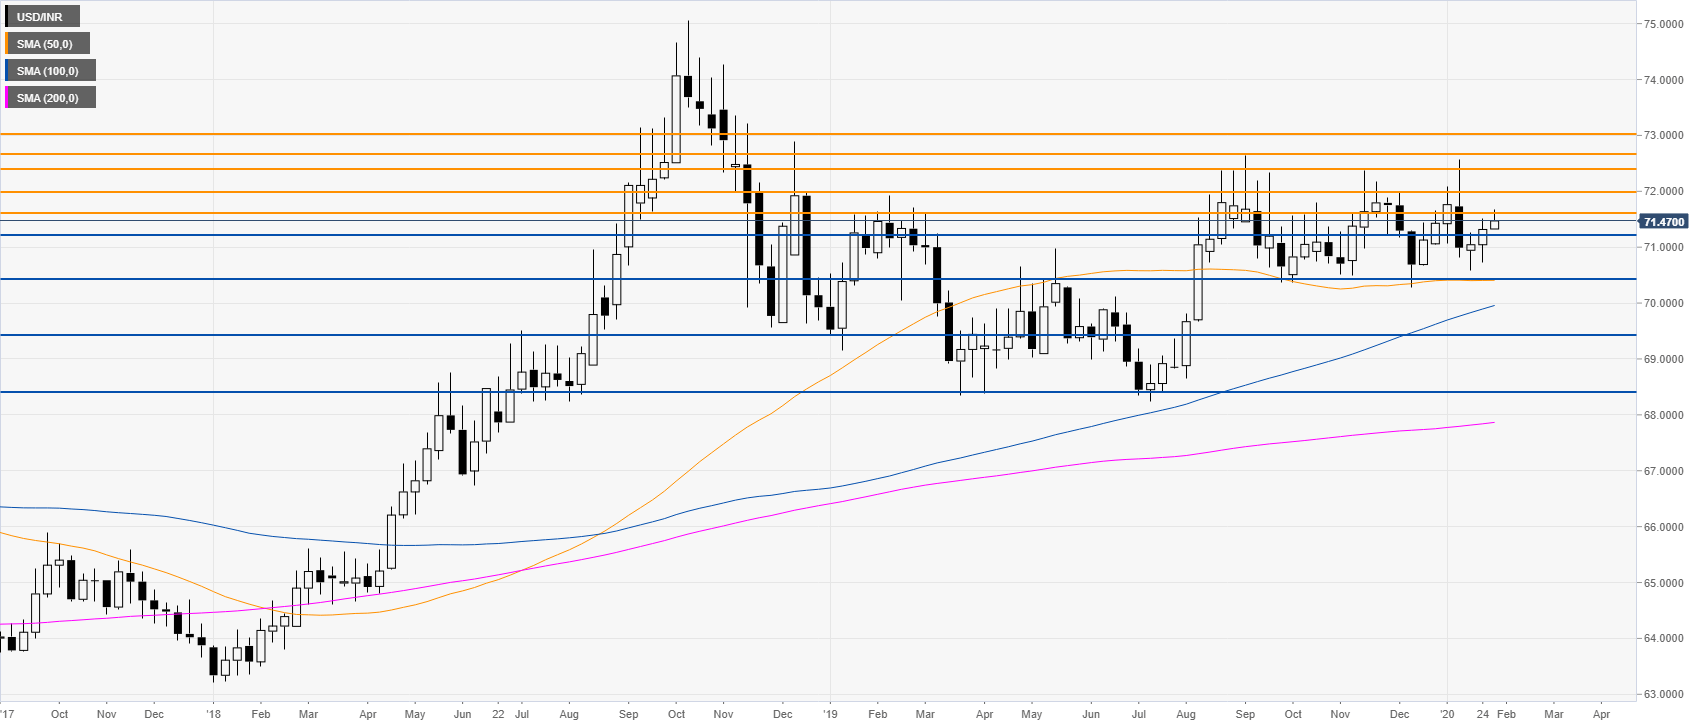
USD/INR daily chart
The spot is trading in a rectangle formation in the 70.40-72.40 range as it is holding above the main simple moving average (SMA). As the market is reversing from the lower end of the range, the market could be set to appreciate towards 71.60, 72.00 and 72.40 levels. Support is seen at the 71.20 and 70.40 levels.
Additional key levels
