- USD/INR makes cautious moves in the Asian session.
- The pair awaits a confirmation on the daily chart before any directional move.
- Bearish MACD favors the downside momentum.
The USD/INR pair seems to hold the lower ground in early dealings on Tuesday. The pair follows the previous day’s sluggish move within a narrow trade band for the time being.
The pair is under continuous selling pressure following the April 21 high at 75.63 and witness heavy price correction.
USD/INR daily chart
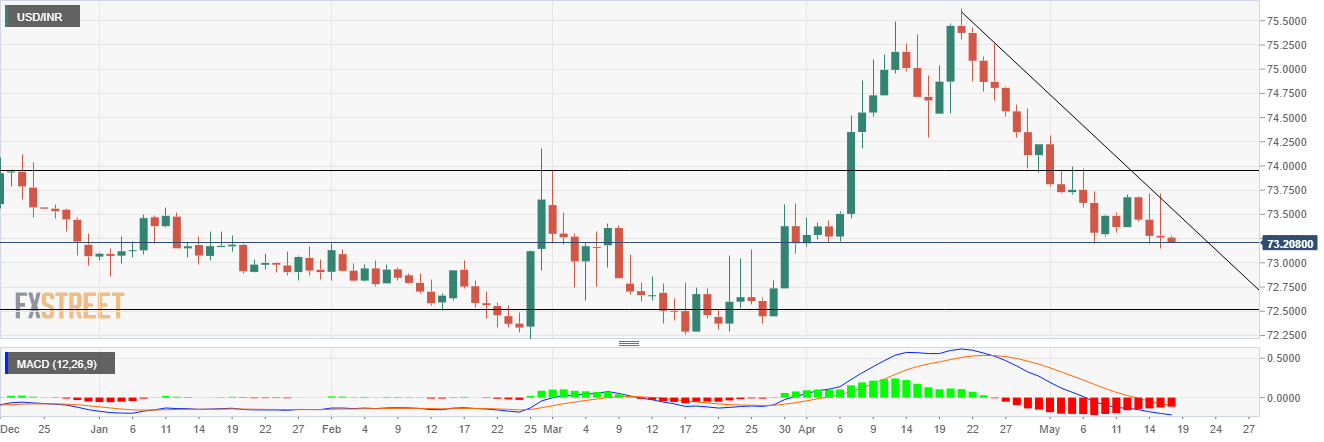
On the daily chart, the USD/INR pair is hovering in the vicinity of the previous day’s closing at 73.26. The mentioned price level is seen as a critical level with the formation of multiple bottoms in the 73.20 area.
If the price takes the consideration of the multi support as stated above, then it would seek the first upside target at the May 11 high at 73.52. The descending trendline from the highs of 75.63 acts as a defense for the USD/INR bulls.
A break above the trend line would prompt fresh buying opportunities towards the 73.95 horizontal resistance level, which would provide additional strength to the bulls to take over the April 30 high at 74.22.
On the flip side, if the price sustains below the 73.20 level, then it could touch the levels last seen in March, with the first stop at the March 31 low at 73.09. It could further retest the March 30 low at 72.73.
The negative Moving Average Convergence (MACD) indicator could help bring the 72.50 horizontal support level back into the picture.
USD/INR Additional Levels
