- USD/INR struggles to extend recovery moves from 75.45.
- 75.45/39 area can offer immediate support ahead of two-month horizontal line.
- 23.6% Fibonacci retracement, monthly top act as additional resistance.
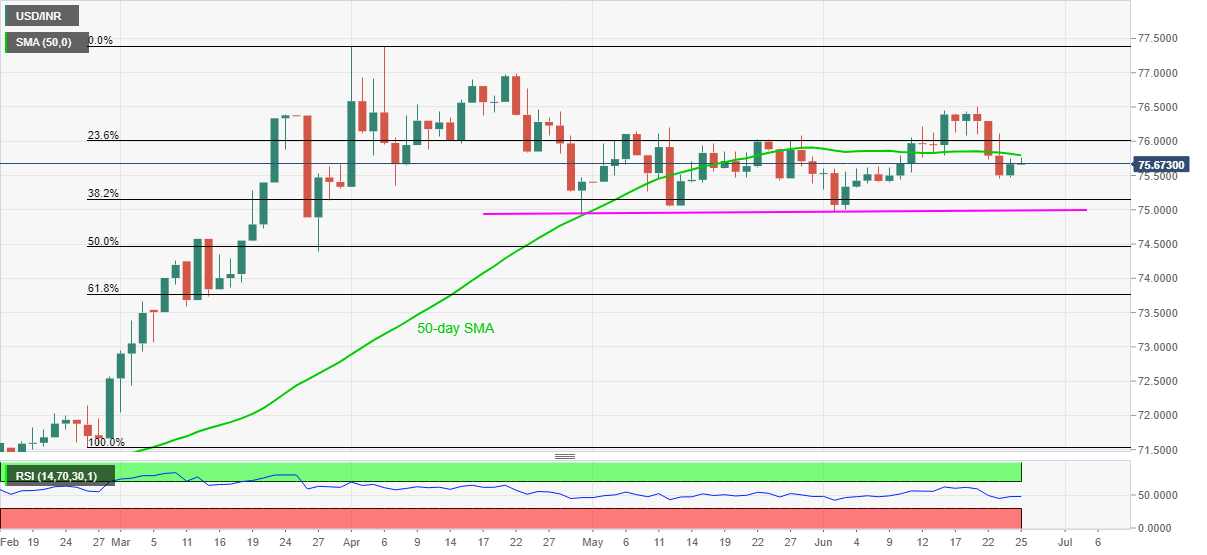
USD/INR eases from the intraday high of 75.77 to 75.69 during the initial Indian trading session on Thursday. In doing so, the pair takes U-turn just ahead of the 50-day SMA while also carrying the pullback from a two-week low flashed on Tuesday.
Looking at the normal RSI conditions, coupled with the near-term strong resistance on the upside, the quote might extend its recent weakness towards revisiting the weekly low of 74.46. However, multiple lows around 74.45/39 could restrict the pair’s further weakness.
If at all the sellers remain weak past-74.39, horizontal support comprising the lows marked from April, around 75.00-74.99, regain the market’s attention.
On the upside, a daily closing beyond 50-day SMA level of 75.80 will escalate the recovery moves toward 23.6% Fibonacci retracement of the pair’s rise between February 26 and April 09, near 76.00.
During the bulls’ further dominance past-76.00, the monthly top close to 76.50 will become their favorite.
USD/INR daily chart
Trend: Pullback expected
