- USD/INR bears attack the intraday low, snaps three-day recovery moves.
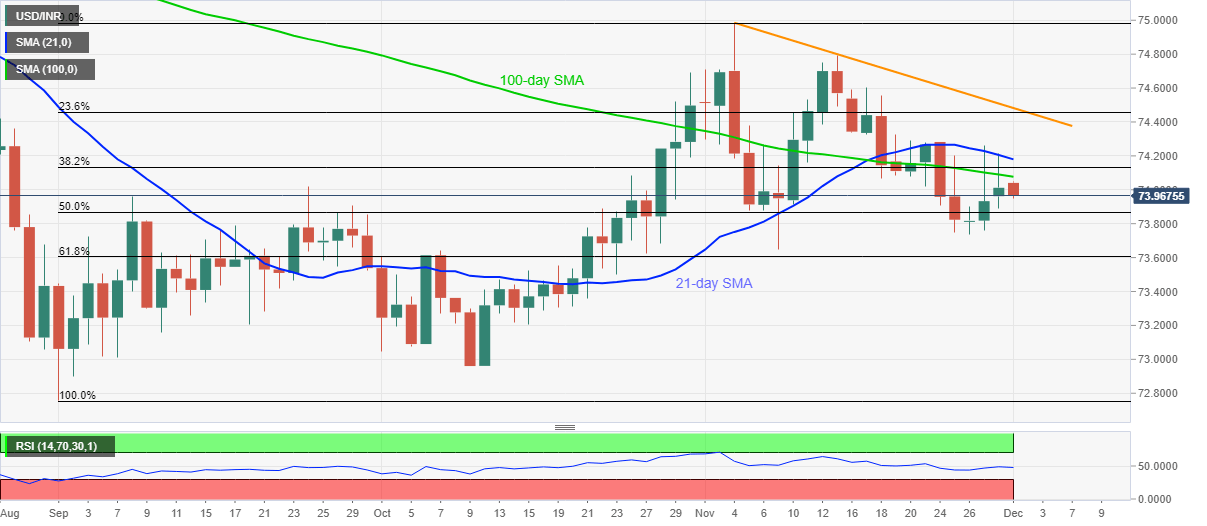
- 21-day and 100-day SMA limits immediate upside, one-month-old falling trend line adds to the resistances.
- Sellers may again attempt to break key Fibonacci retracement levels.
USD/INR stands on the slippery grounds while declining to 73.95, down 0.07% on a day, during early Tuesday. In doing so, the quote extends pullback from the key SMAs amid normal RSI conditions.
Considering the pair’s repeated failures to cross 21-day and 100-day SMAs, Indian rupee buyers are likely targeting 50% Fibonacci retracement level of September-November upside, at 73.86, ahead of challenging the latest bounce point, Thursday’s low, near 73.73.
In a case where the USD/INR sellers keep the reins past-73.73, the 61.8% Fibonacci retracement level of 73.60 and 73.20 may return to the chart before highlighting October’s low near 72.96.
Alternatively, 100-day SMA, currently around 74.07, precedes a 21-day SMA level of 74.17, to challenge any recovery moves.
Also acting as the key upside hurdle is a falling trend line from November 04, at 74.48 and the previous month’s peak close to the 75.00 threshold.
USD/INR daily chart
Trend: Further weakness expected
