- USD/INR recovers from the one-week low.
- Multiple supports on the downside will question the sellers.
- Buyers may await a break of the short-term horizontal resistance.
While defying its previous three-day losing streak, USD/INR takes the bids to 75.87, up 0.27%, amid the initial Indian trading session on Wednesday.
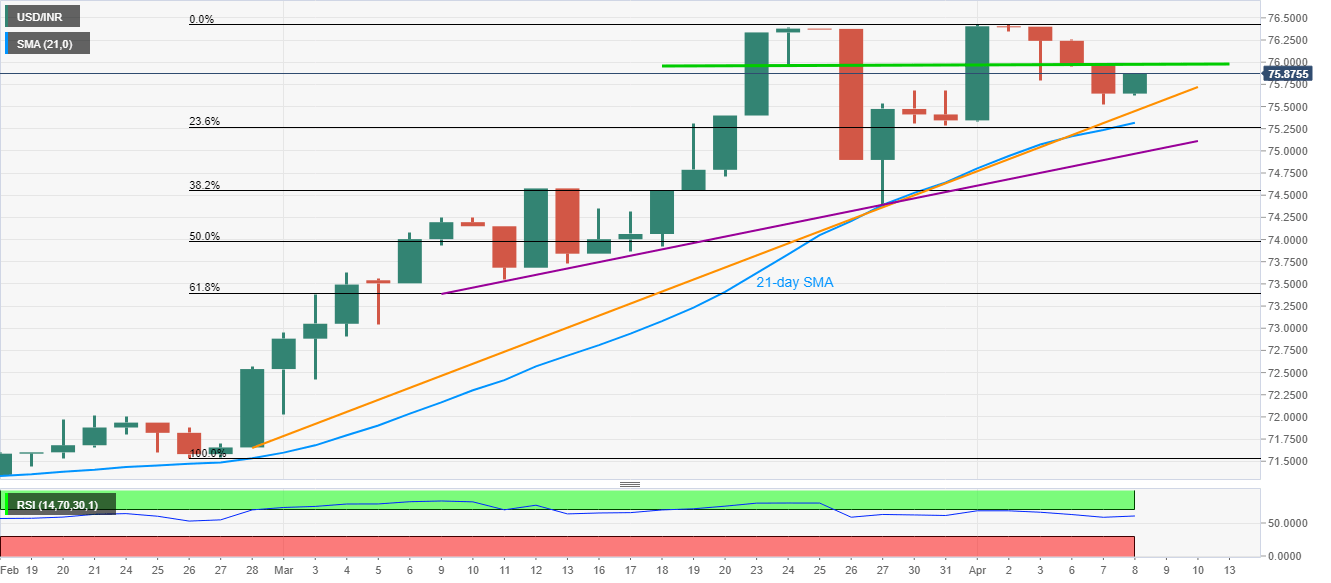
That said, the pair nears an ascending trend line since February 28 as well as 21-day SMA while also stays below a horizontal line comprising lows marked on March 24 and April 06.
The quote currently aims to confront the mentioned horizontal resistance around 75.95/76.00, a sustained break of which could escalate the recovery moves towards 76.25 and the latest high near 76.43.
Alternatively, the immediate support trend line and 21-day SMA will check the sellers around 75.97 and 75.32 respectively.
If at all USD/INR remains below 75.32 on a daily closing basis, an upward sloping trend line from March 11, near 74.96 will gain the bears’ attention.
USD/INR daily chart
Trend: Bullish
