- USD/INR remains below 61.8% Fibonacci retracement for the last four weeks.
- The yearly bottom holds the key to 70.00.
- A descending trend line from early January adds to the resistance.
USD/INR trades modestly negative around 71.23 during the initial hours of the Indian session on Friday. In doing so, the pair remains above the short-term rising support line. Though, repeated failures to cross the key Fibonacci retracement and a resistance line continue to favor the sellers.
As a result, the bears can take entry as soon as the prices drop below 71.15 support line, targeting the yearly low near 70.58.
The buyers are likely to sneak in around 70.20 or 70.00 during the pair’s further downside below 70.58.
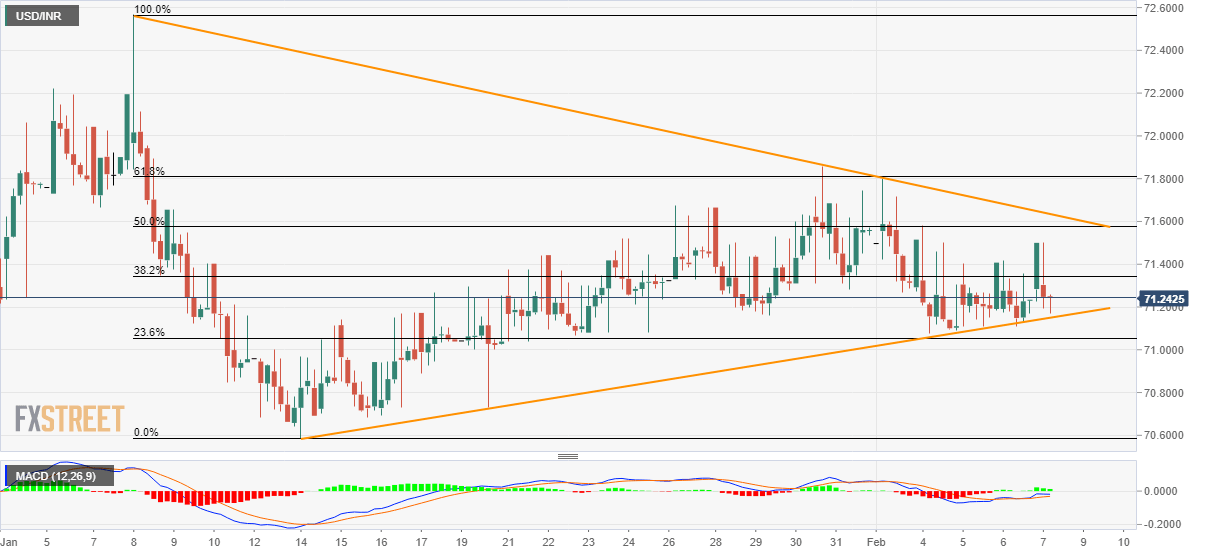
Alternatively, a downward sloping trend line from January 08, at 71.65, followed by 61.8% Fibonacci retracement of the pair’s early-January drop, at 71.81, will be the key resistances to watch.
Should prices manage to remain strong above 71.81, 72.00 and the yearly top close to 72.60 will return to the charts.
USD/INR four-hour chart
Trend: SIdeways
