- USD/INR nears the record high flashed during the last week.
- The depleting strength of MACD histogram, overbought RSI conditions signal a pullback.
- January month high, yearly support line can lure sellers.
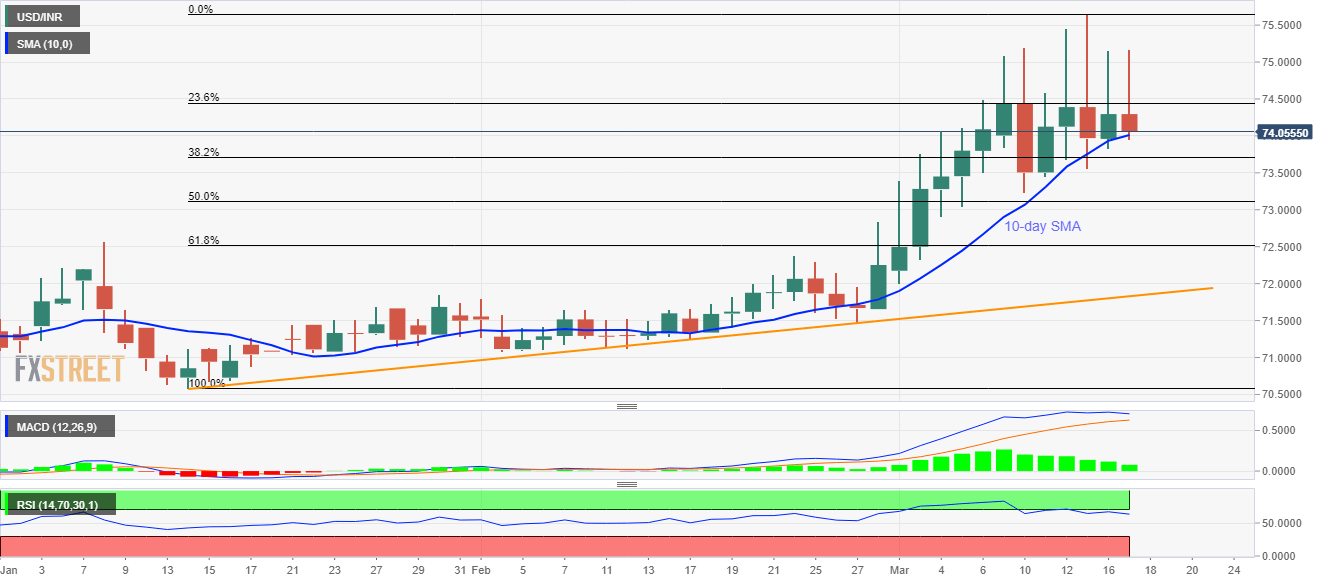
USD/INR drops back to re-test 10-day SMA, while flashing 74.04 as a quote, down 0.34%, ahead of the European session on Tuesday.
Despite flashing the record high of 75.65 on Friday, the pair failed to extend the run-up while remaining below 23.6% Fibonacci retracement of its run-up from January low to the latest high.
Considering the failures to extend the run-up, coupled with softening MACD histogram strength and declining RSI from the overbought area, USD/INR prices are likely to register fresh pullbacks.
In doing so, a 10-day SMA level of 74.07 can act as the trigger for the fresh downside towards a 50% Fibonacci retracement level of 73.10. However, January month high near 72.57 could question the bears afterward.
Alternatively, buyers will wait for a sustained rise past-23.6% Fibonacci retracement level of 74.45, to aim for 75.00 and extend the northward trajectory beyond 75.65 towards 76.00 round-figure.
USD/INR daily chart
Trend: Pullback expected
