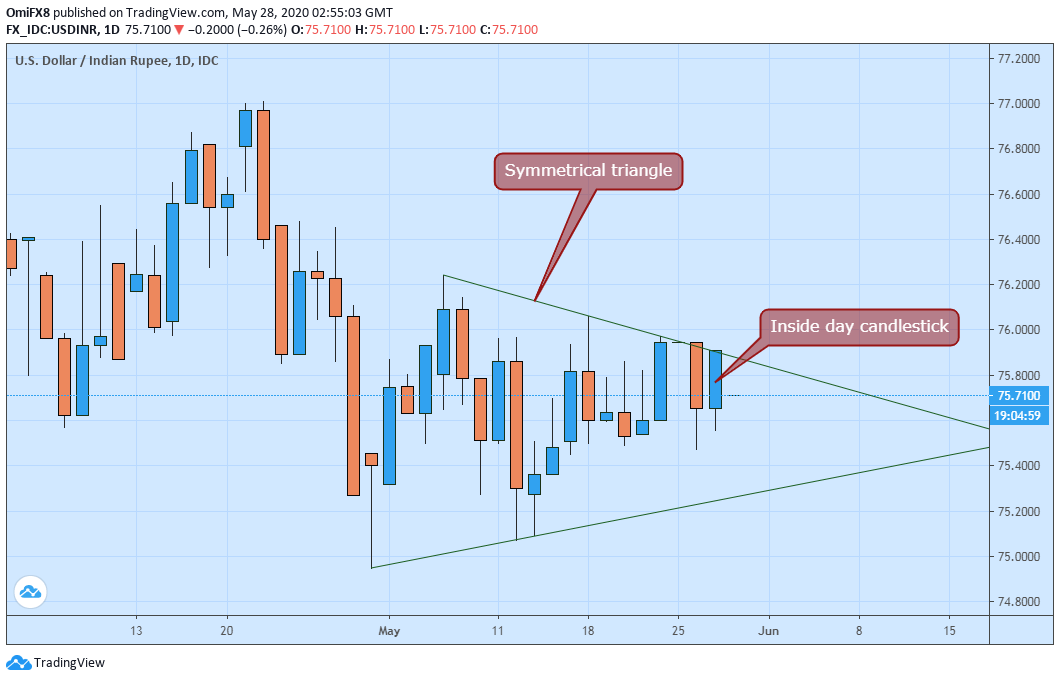
- USD/INR created an inside day candle on Wednesday, making Thursday’s close pivotal.
- Daily chart also shows a symmetrical triangle pattern.
The USD/INR market looks to have turned indecisive.
The currency pair rose 0.34% on Wednesday but traded well within the preceding day’s high and low. Essentially, the pair created an “inside day” candlestick pattern on Wednesday, which is indicative of indecision or range play in the market.
A close above Tuesday’s high of 75.946 would mean the bulls have emerged victorious in a tug of war with the bears. That would also confirm a symmetrical triangle breakout on the daily chart and open the doors to the re-test of the 2020 highs near 77.00. The pair has been restricted to a narrowing price range since April 30.
While a close above 75.946 would activate twin bullish cues, a move below Tuesday’s low of 75.47 would confirm an inside day bearish candlestick pattern. However, the outlook as per the daily chart would turn bearish if and when the pair dives out of the bigger symmetrical triangle.
Daily chart
Trend: Neutral
Technical levels
