- USD/INR takes a U-turn from one-week top, snaps three-day winning streak.
- Four-month-old previous resistance line lures the pair sellers.
- Highs marked during December 2020, February 2020 top add to the upside barriers.
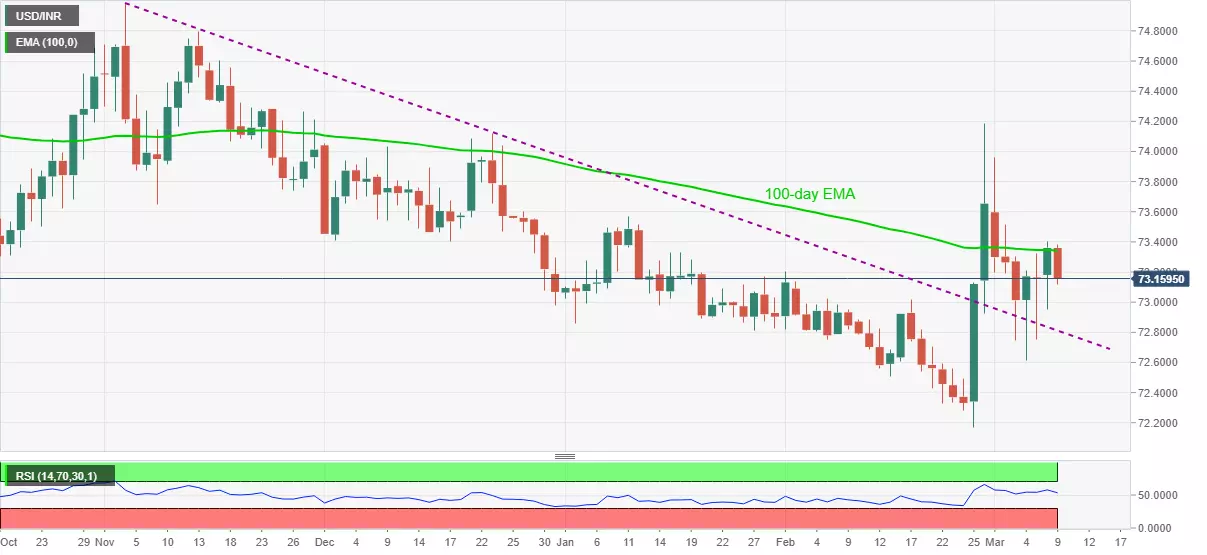
USD/INR follows the footsteps of other US dollar crosses while benefiting from the greenback’s weakness during early Tuesday. In doing so, the quote reverses from 100-day EMA to post the heaviest losses in a week while recently declining to 73.11, currently down 0.26% intraday near 73.17.
Considering the quote’s repeated pullbacks from 100-day EMA, coupled with downward sloping RSI, the USD/INR sellers may again target the previous resistance line from November 04, at 72.80 now.
However, any further weakness past-72.80 may not hesitate to challenge February’s low, also the lowest since March 2020, around 72.17.
Meanwhile, an upside break of 100-day EMA level of 73.34 will need validation from the 74.00 threshold before directing the USD/INR bulls to the tops marked during late 2020 and February 2021, respectively around 74.10 and 74.20.
Overall, USD/INR remains on the back foot but the US dollar strength raises bars for the seller’s entry.
USD/INR daily chart
Trend: Pullback expected
