- USD/INR bounces off fresh low since March 2020, marked on Friday.
- Corrective pullback battles weak RSI, downbeat MACD signals, confirmed bearish chart pattern favor sellers.
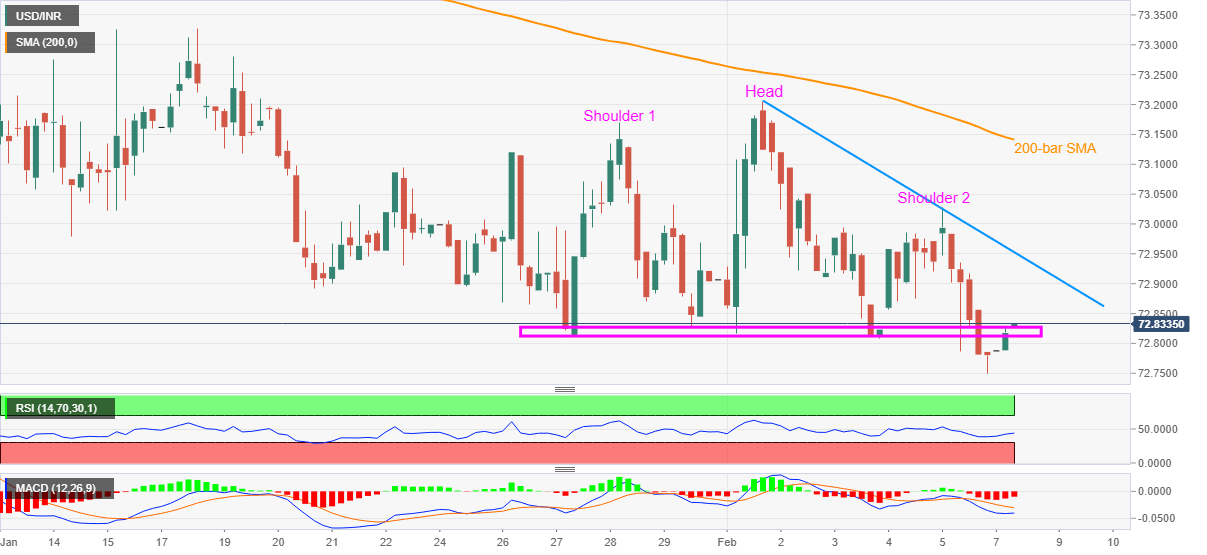
- Weekly resistance line, 200-bar SMA add to the upside barriers.
USD/INR picks up bids around 72.83 as Indian trading starts on Monday. In doing so, the Indian rupee pair recovers from the multi-day low flashed on Friday.
However, the bulls fail to gain support from RSI and MACD as they try to defy the previous day’s confirmation of a bearish chart pattern called head-and-shoulders on the four-hour (4H) chart.
As a result, the USD/INR bears stay hopeful unless the quote crosses the 72.85 level. Also acting as an upside barrier is the falling trend line from the February-start, near 72.96, as well as a 200-bar SMA level of 73.15.
On the contrary, sustained weakness below 72.85 drags USD/INR towards the theoretical target of 72.40 whereas the January 2020 peak surrounding 72.20 can entertain the Indian rupee bulls afterward.
Overall, the USD/INR has confirmed a bearish chart pattern, backed by downbeat oscillators, which in turn defies the latest uptick in prices.
USD/INR four-hour chart
Trend: Bearish
