- USD/INR prints mild losses below 73.50 after stepping back from a three-week-old resistance line, a confluence of 100 and 200-bar SMA.
- Normal RSI suggests further weakness, bulls will have the key Fibonacci retracement as additional filters to the north.
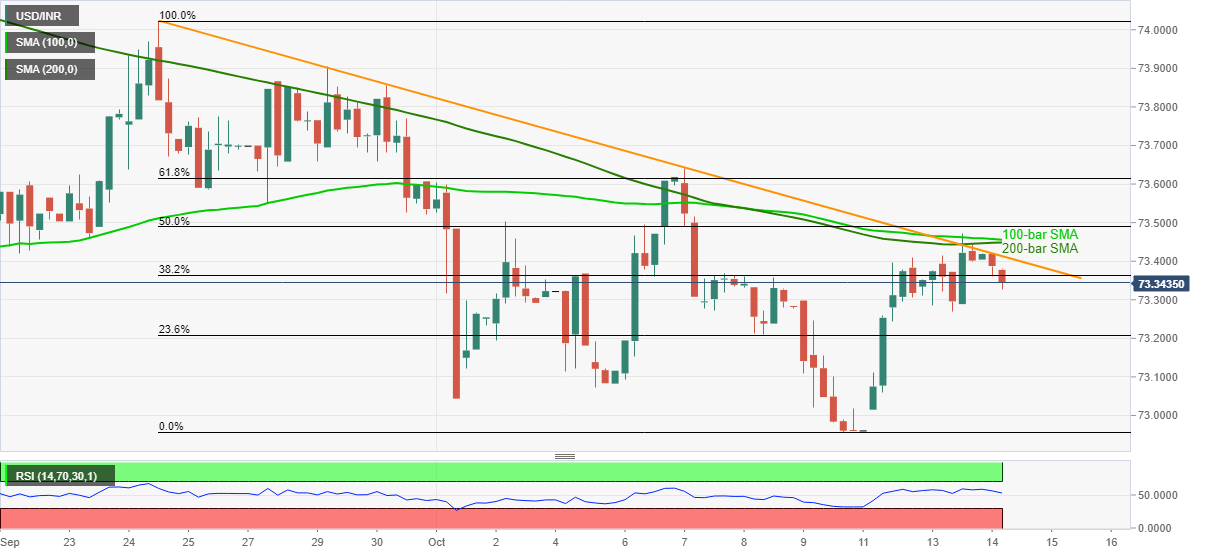
USD/INR declines to 73.34, down 0.09% intraday, during the initial hour of Wednesday’s Indian trading session. The pair took a U-turn from the joint of 100-bar and 200-bar SMAs the previous day and extended the weakness below a falling trend line from September 24 so far during today.
Given the absence of overbought/oversold RSI conditions, the sellers are likely to respect the pullback from strong resistances while targeting the 23.6% Fibonacci retracement level of September 24 to October 11 downside, at 73.20.
Though, 73.10 and the 73.00 round-figure could challenge the USD/INDR bears ahead of highlighting the monthly bottom close to 72.95.
Alternatively, the aforementioned resistance line and key SMAs, near 73.40 and 73.45/46 respectively, can act as immediate upside barriers for the buyers to watch before confronting with a 50% Fibonacci retracement level near 73.50.
If at all the USD/INR bulls manage to cross 73.50, 61.8% Fibonacci retracement near 73.62 and the monthly top near 73.65 could entertain the traders prior to fueling the quote towards the late-September highs around 73.90.
USD/INR four-hour chart
Trend: Further weakness expected
