- USD/INR drops to the fresh low since March 2020, prints three-day downtrend.
- Bullish chart formation, nearly oversold RSI keeps buyers hopeful.
- Bears can eye early 2020 tops during further weakness.
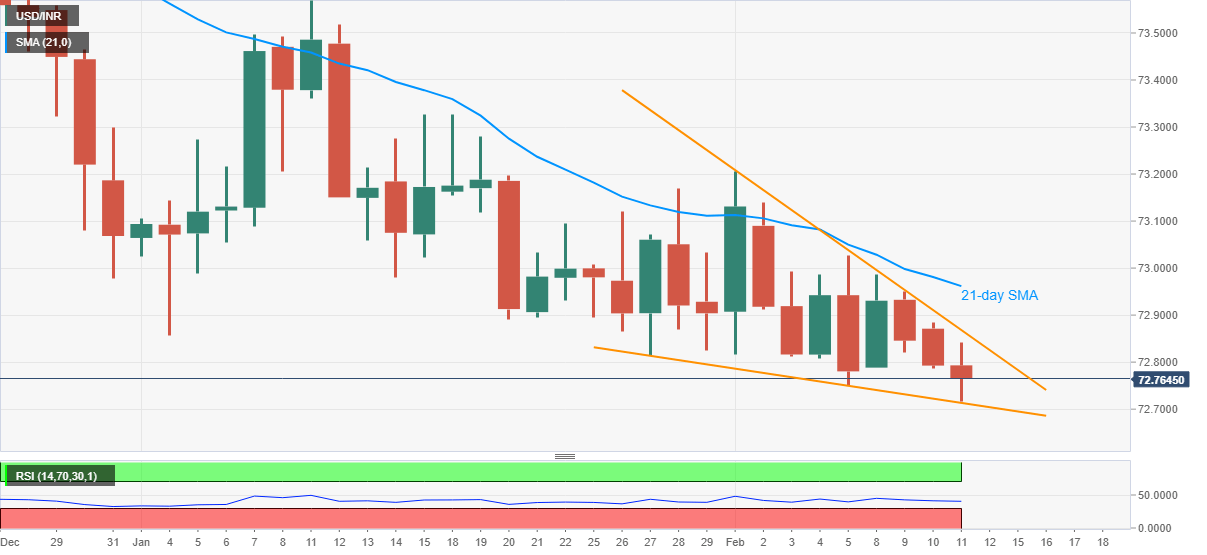
USD/INR declines to the fresh low since March 2020 before bouncing off 72.71 ahead of Thursday’s European session.
Although pair’s sustained trading below 21-day SMA and monthly descending trend line keeps favoring USD/INR sellers, a bullish chart pattern formation called falling wedge warrants the buyers to stay hopeful unless breaking immediate support line, at 72.70 now.
It should, however, be noted the upside confirmation needs validation from the 21-day SMA level of 72.96, in addition to the stated pattern’s resistance line near 72.87, before recalling the USD/INR buyers.
On the contrary, a daily closing below 72.71 will fetch the quote to January 2020 highs near 72.20 whereas the 72.00 threshold can lure the USD/INR bears afterward.
Overall, USD/INR sellers seem tired and hence a corrective pullback cannot be ruled out.
USD/INR daily chart
Trend: Pullback expected
