- USD/INR remains depressed within a two-week-old trading range.
- Bears await a downside break of previous resistance for fresh entries.
- 200-bar SMA adds to the upside filters beyond 73.20.
USD/INR drops to 72.93 amid the initial Indian session trading on Wednesday. In doing so, the quote nullifies Monday’s upside break of a falling trend line from December 22 while keeping the recent trading range between 72.80 and 73.20.
Considering the downward sloping RSI and failures to break the stated range on the upside, USD/INR bears are waiting for entries. Though, a clear breakdown of the previous resistance, at 72.87 now, will give confirmation.
It should be noted that the latest low, also the lowest since September, near 72.80, offers extra support before dragging the quote towards the early 2020 top close to 72.20.
Meanwhile, an upside clearance of the 73.20 range resistance needs validation from a 200-bar SMA level of 73.22 to challenge January’s peak of 73.56.
Also acting as the resistance is the 61.8% Fibonacci retracement level of the late December-January declines, near 73.65.
Overall, USD/INR portrays the downtrend while the adjacent support line may offer intermediate bounces.
USD/INR four-hour chart
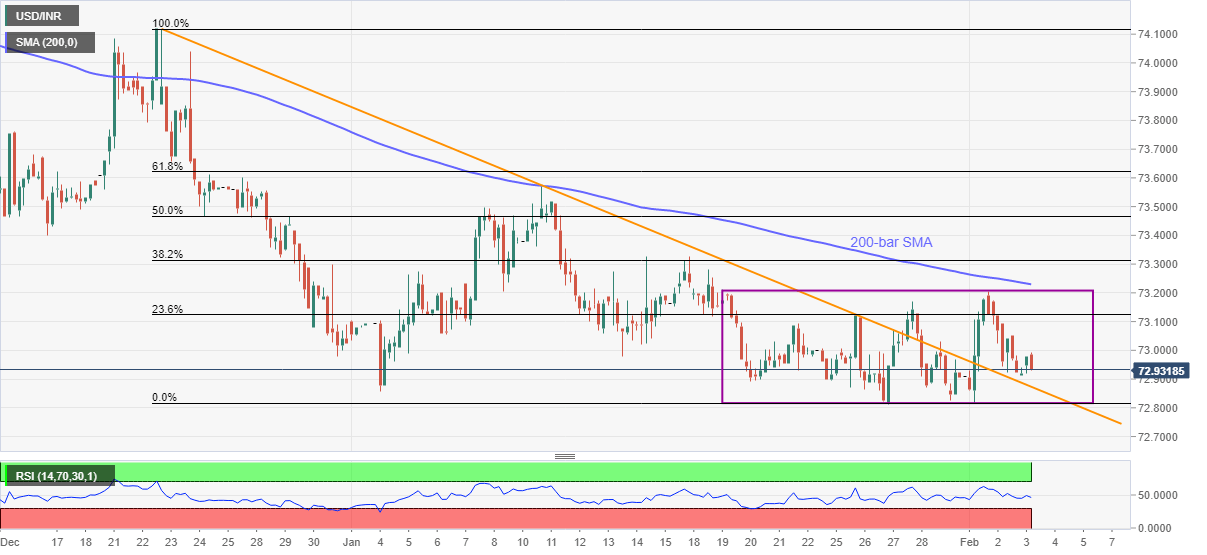
Trend: Bearish
