- A confluence region around 69.82/85, comprising key EMAs, limits near-term USD/INR upside.
- 10-week old horizontal support regains market attention during the pullback.
With the 100 and 200-day exponential moving averages (EMA) limiting the USD/INR pair’s immediate upside, the quote is taking the rounds to 69.25 during early Thursday.
Considering the pair’s failure to cross the key resistance confluence, its drop to re-test the 69.00 – 69.05 area can’t be denied.
However, additional weakness beneath 69.00 might not refrain from calling the March month low of 68.34 back to the chart.
On the upside break of 68.82/85 confluence region, the pair can initially rise to 50% Fibonacci retracement of February to March downside at 70.13 while targeting May month top surrounding 71.00 during further advances.
USD/INR daily chart
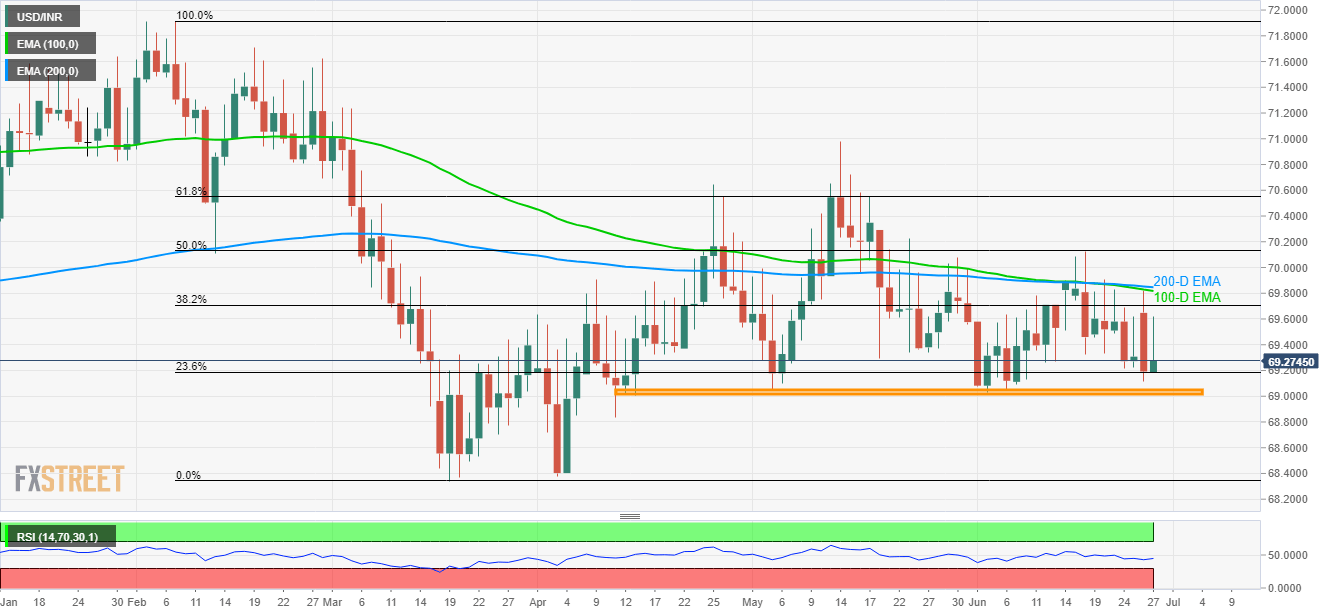
Trend: Bearish
