- 100-DMA limits the USD/INR pair’s pullback moves from ascending trend-line stretched since early April.
- 5-week old resistance-line acts as an additional upside barrier.
- Lower highs, declining RSI favor odds for the downside.
In spite of portraying another bounce off the 11-week old support-line, USD/INR fall short of clearing 100-day moving average (100-DMA) as it trades near 69.3165 during early Tuesday.
Not only failure to cross important MA but a lower high formation during the last 1-week period and downward sloping 14-day relative strength index (RSI) also signal brighter chances of the quote’s decline below 69.2169 trend-line support.
In doing so, the fresh leg down can target early-month bottom surrounding 69.0450 whereas April 11 low of 68.8355 and March trough close to 68.3415 may flash on bears’ radar then after.
Meanwhile, an upside clearance of 100-DMA level of 69.6610 can propel the pair towards 69.9466 resistance-line.
If at all buyers manage to cross 69.9466 upside barrier, 70.00 round-figure and 50% Fibonacci retracement of December – March downpour around 70.5808 can offer intermediate halts to the pair’s rally towards 200-DMA level of 70.7955.
USD/INR daily chart
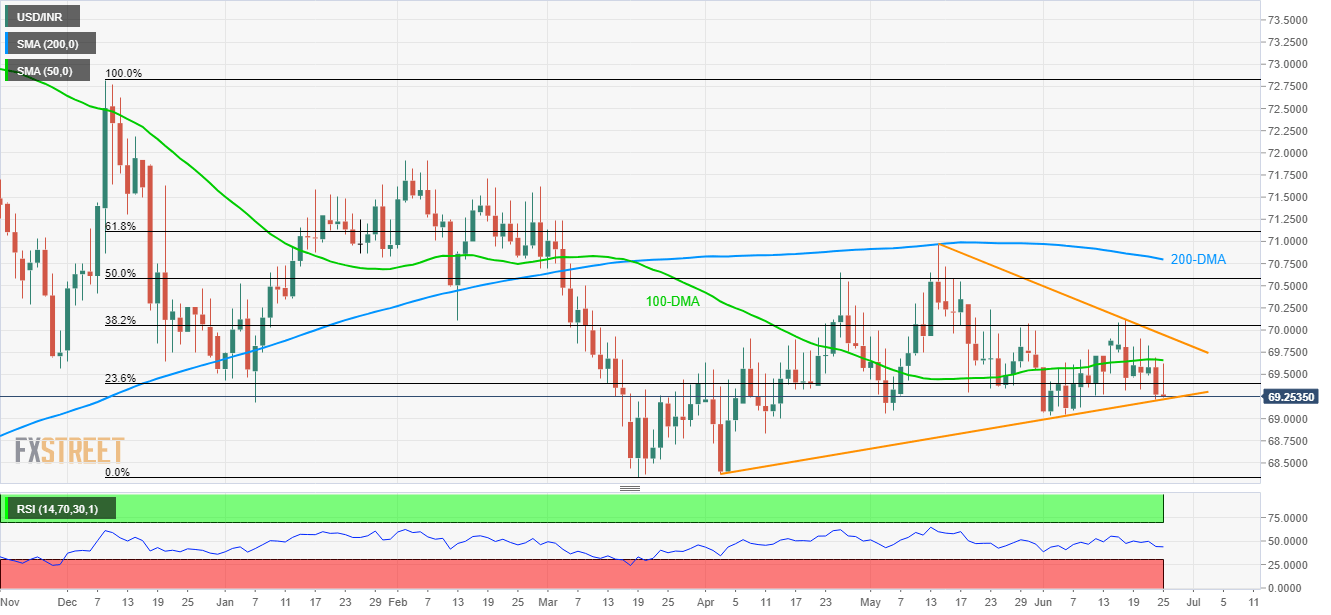
Trend: Bearish
