- USD/INR remains below 61.8% Fibonacci retracement of September month declines.
- 200-bar SMA, monthly trend-line seems to be the key supports.
Even after declining from 61.8% Fibonacci retracement, coupled with a bearish MACD signal, USD/INR stays above 200-bar SMA, around 71.40, while heading into the European session opening on Thursday.
Sellers await pair’s dip beneath the key Simple Moving Average (SMA) level of 71.28 in order to target the monthly ascending trend line, at 70.80. However, pair’s further weakness might not refrain from aiming 70.40 and 70.00 supports.
In a case, buyers ignore bearish signal by 12-bar Moving Average Convergence and Divergence (MACD), while also successfully clearing 61.8% Fibonacci retracement level of 71.77, 72.00 will flash on their radar.
Assuming the pair’s sustained rise beyond 72.00, 72.40 and 72.65 can offer intermediate halts to its rally towards 73.00 round-figure.
USD/INR 4-hour chart
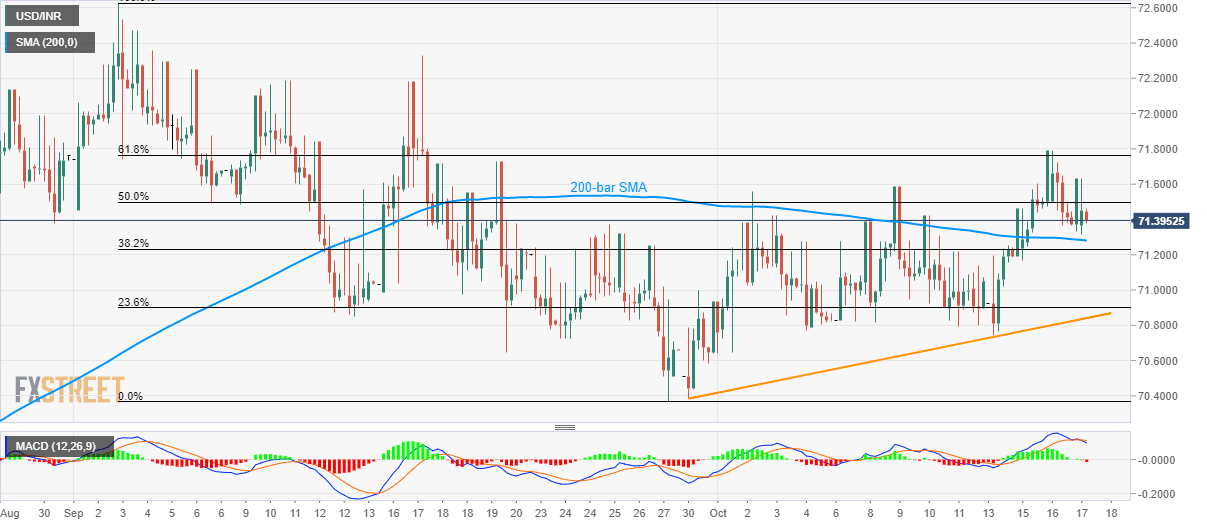
Trend: pullback expected
