- USD/INR bounces off 21-day EMA, clings to 23.6% Fibonacci retracement even after breaking four-week-old support-line.
- Sellers can look for 71.30 on the break below the near-term moving average.
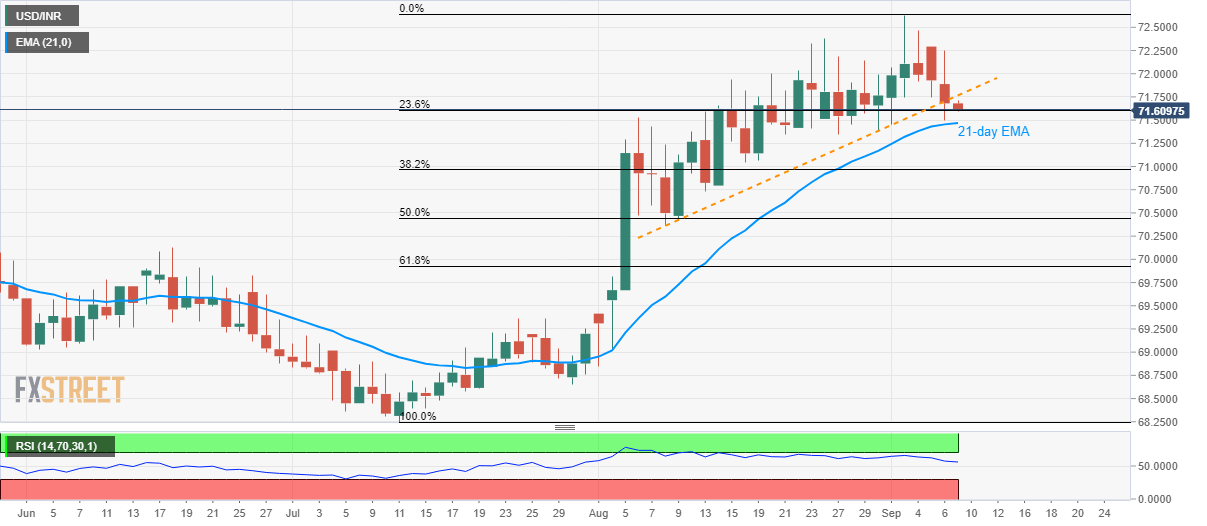
Despite breaking a month-old support-line, USD/INR fails to slip below the 21-day exponential moving average (EMA) as it takes the rounds to 71.62 ahead of Monday’s European open.
Adding to the pair’s immediate support is 23.6% Fibonacci retracement of July-September upside, at 71.60, a break of which will test 21-day EMA level of 71.47.
In a case where prices slip below 71.47 on a daily closing basis, August 13 low near 71.30 and 50% Fibonacci retracement level close to 70.50/45 will flash on sellers’ radar.
Alternatively, an upside clearance of 72.30 enables the pair to again head for 73.00 with the latest high surrounding 72.65 likely being an intermediate halt.
USD/INR daily chart
Trend: bullish
