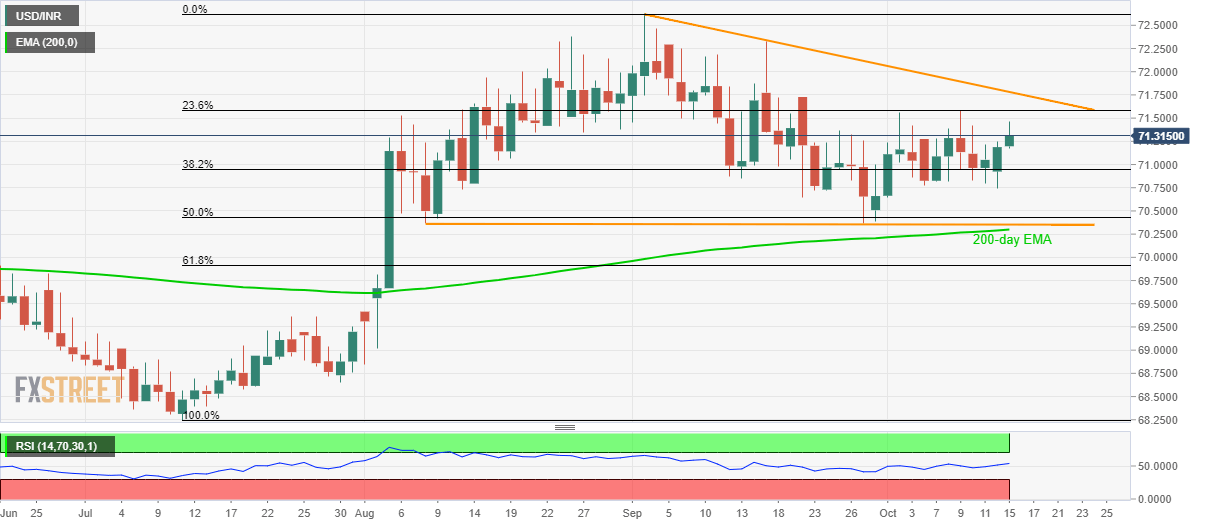
- USD/INR is on a recovery mode for the third consecutive day.
- 23.6% Fibonacci retracement of July-September limits immediate upside.
- A downward sloping trend-line since September 03 adds to the resistance.
The USD/INR pair’s successful run-up for the third consecutive day propels it to 71.32 ahead of the European open on Tuesday.
However, the pair still trades below 23.6% Fibonacci retracement level of 71.58 that has been restricting the upside since month-start, a break of which could escalate the recovery towards six-week-old falling trend-line resistance, at 71.78.
In a case prices keep rising past-71.78, 72.33 and 72.65 will be on the bulls’ radar.
Meanwhile, 70.75 can entertain short-term sellers ahead of pleasing them with 70.35/30 area including two-month long horizontal support and 200-day Exponential Moving Average (EMA).
USD/INR daily chart
Trend: pullback expected
