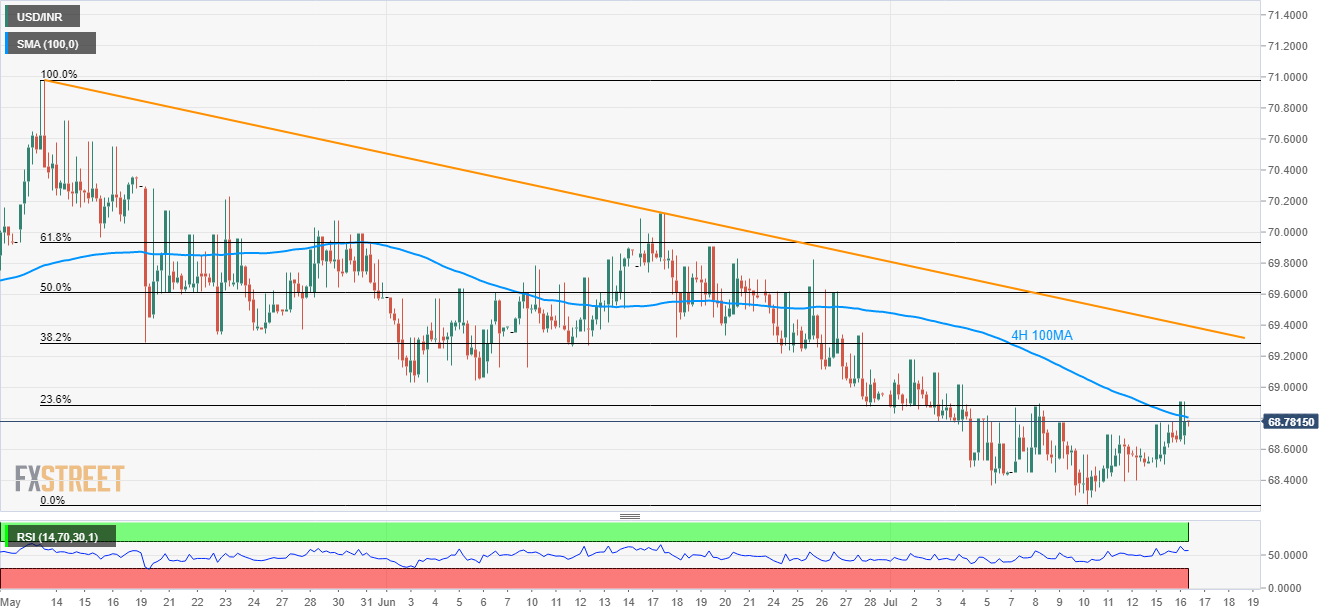
- The USD/INR pair’s recovery from 68.25 falls short of clearing near-term key resistances, indicating momentum weakness.
- 9-week old descending trend-line can question buyers past-68.91.
Unless breaking 100-bar moving average on the 4-hour chart (4H 100MA) and 23.6% Fibonacci retracement of May-July downpour, USD/INR pullback remains less significant as it trades near 68.77 heading into the European open on Wednesday.
Even if the pair manage to clear 68.80 and 68.91 levels, carrying aforementioned indicators, a 9-week old descending resistance-line stretched since mid-May around 69.40 could challenge buyers.
Though, pair’s rise past-69.40 enables it to aim for 70.00 psychological magnet.
On the flip side, 68.45 can act as close support before the latest low surrounding 68.25 regains market attention.
Also, pair’s sustained declines below 68.25 open the gate for fresh south-run to late-June 2018 bottom at 67.6850.
USD/INR 4-hour chart
Trend: Pullback expected

