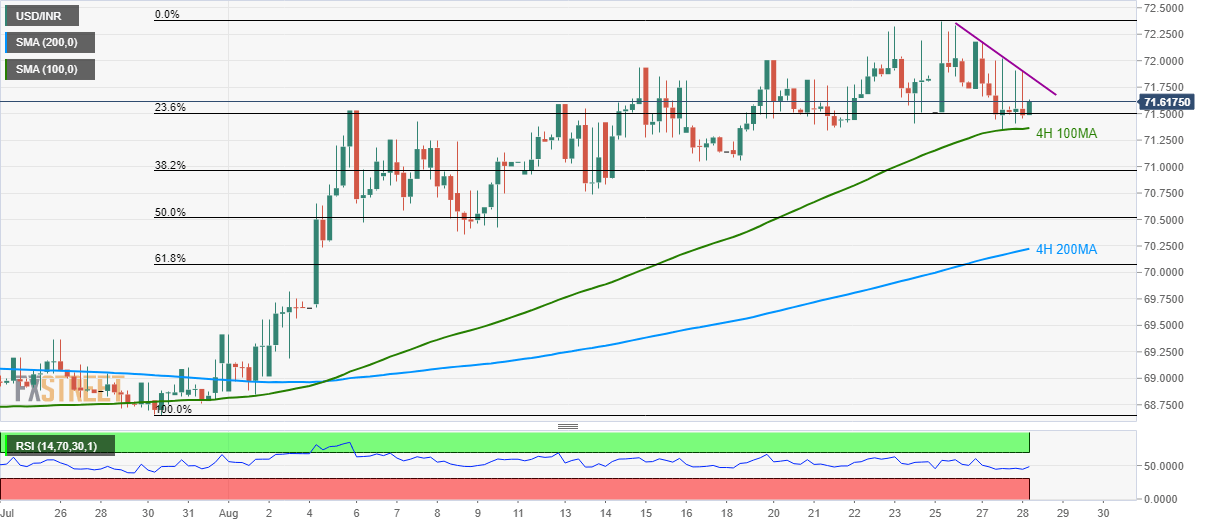
- USD/INR seesaws near 100-bar moving average on the four-hour chart (4H 100MA).
- Short-term falling trend-line restricts further advances.
Even if a two-day-old descending trend-line portrays the USD/INR pair’s weakness, the quote remains strong unless breaking 4H 100MA. The pair currently takes the rounds to 71.62 by the press time being ahead of the European session on Wednesday.
In a case prices slip below 4H 100MA level of 71.37, 71.00 and August 13 low of 70.76 can offer intermediate halts to the declines targeting 50% Fibonacci retracement of July-end to early-August rise, near 70.50.
During the course of pair’s further weakness below 70.50, 200-bar moving average (4H 200MA) at 70.22 becomes the key to watch.
Alternatively, an upside clearance of immediate resistance-line, at 71.86, can propel prices to 72.20 and then to recent high surrounding 72.40.
Additionally, the pair’s sustained increase above 72.40 enables it to challenge December 2018 top surrounding 72.82.
USD/INR 4-hour chart
Trend: Bullish
