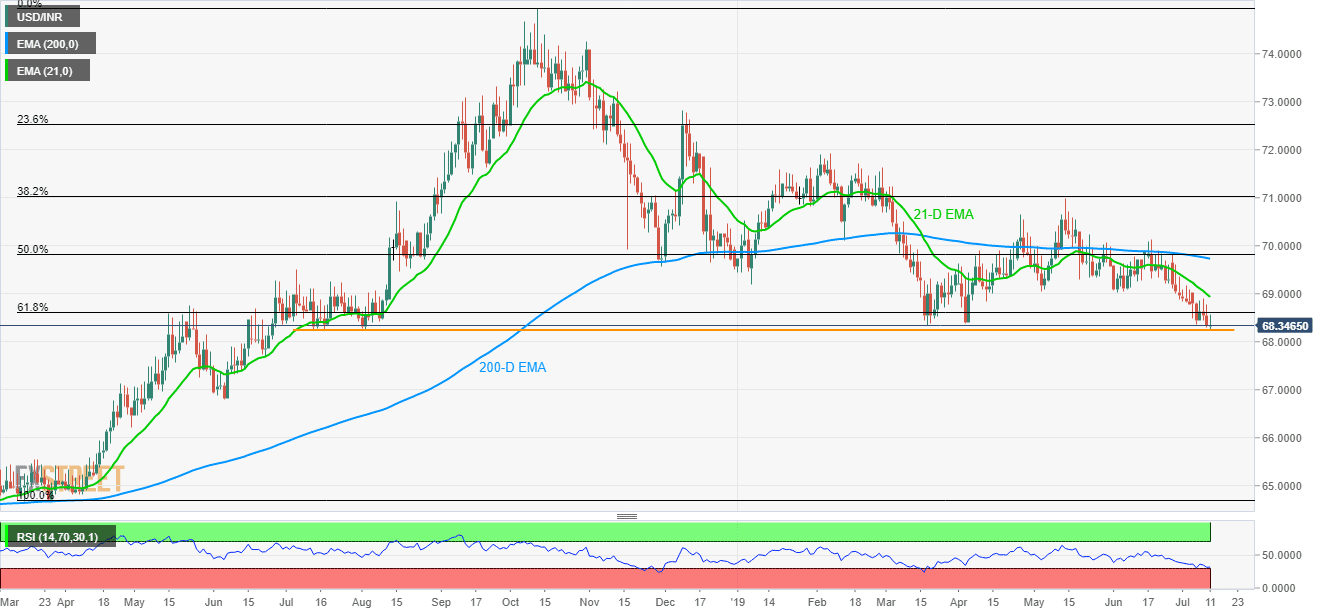
- USD/INR drops to an 11-month low by following downward sloping 21-D EMA.
- Year-Old horizontal support can trigger the pair’s pullback amid oversold RSI conditions.
With the USD/INR traders following a down move beneath the 21-day exponential moving average (21-D EMA), the quote drops to 11-month low while taking the rounds to 68.35 ahead of the European markets open on Thursday.
A year-long horizontal-support around 68.25/26 becomes the key for sellers amid oversold conditions of 14-day relative strength index (RSI).
As a result, prices may take a U-turn towards breaking 61.8% Fibonacci retracement of March to September 2018 rise, at 68.60 which in turn highlights the importance of 21-day EMA level of 68.93.
Given the price rally beyond 68.93, 69.03/05 horizontal area comprising May-June 2019 lows will cap further upside.
Meanwhile, a downside break of 68.25 can further strengthen bears to target 68.00 and June 2018 low surrounding 67.69.
USD/INR daily chart
Trend: Pullback expected

