- USD/INR bounces off 50-bar EMA.
- 100-bar EMA, 50% Fibonacci retracement and a two-week-old rising trend line together constitute strong support.
USD/INR bounces off 50-bar EMA while taking the bids to 71.72 during a pre-European session on Monday.
The pair now heads towards the monthly top nearing 72.37 whereas the September month peak near 72.63 and December month high around 72.82 can entertain buyers ahead of diverting them to 73.00 round-figure.
On the contrary, pair’s declines below 50-bar Exponential Moving Average (EMA) level of 71.58 could drag the quote to 71.40/35 key support confluence including 100-bar EMA, two-week-old rising trend line and 50% Fibonacci retracement of September-November upside.
If bears manage to conquer 71.35 on a daily closing basis, 61.8% Fibonacci retracement around 71.12, 70.70 and monthly bottom close to 70.50 could come back to the charts.
USD/INR 4-hour chart
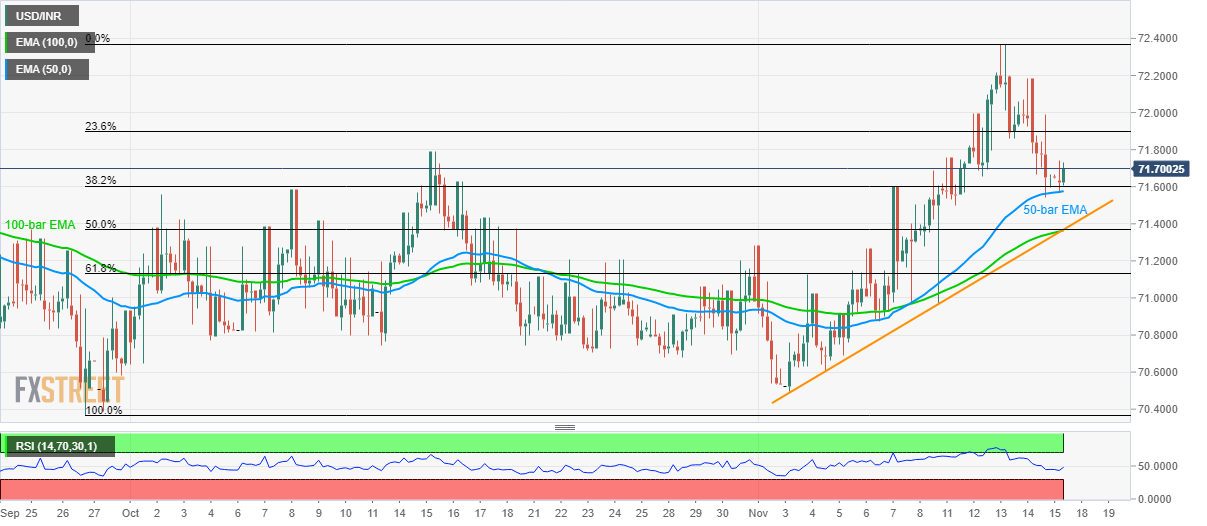
Trend: Bullish
