- A three-week-old rising channel, sustained trading beyond 100-bar EMA portrays bulls’ dominance on the USD/INR momentum.
- While the downside break of 71.45 will trigger fresh drop to August 08 low.
With its successful trading above the 100-bar exponential moving average (EMA), also inside a rising channel, USD/INR takes the bids to 72.00 ahead of the European open on Tuesday.
While August month top surrounding 72.38 acts as an immediate resistance, upper-line of a three-week-old ascending channel formation, near 72.70, seems to be a tough upside barrier to look afterward.
Alternatively, 71.80 can please counter-trend traders before challenging them by 71.50/45 support-confluence that includes 100-bar EMA, channel’s support and 23.6% Fibonacci retracement level of late-July to August upside.
In a case prices slip below 71.45, 71.00 and August 13 low near 70.70 may act as intermediate halts prior to fetching the quote to August 08 bottom close to 70.35
USD/INR 4-hour chart
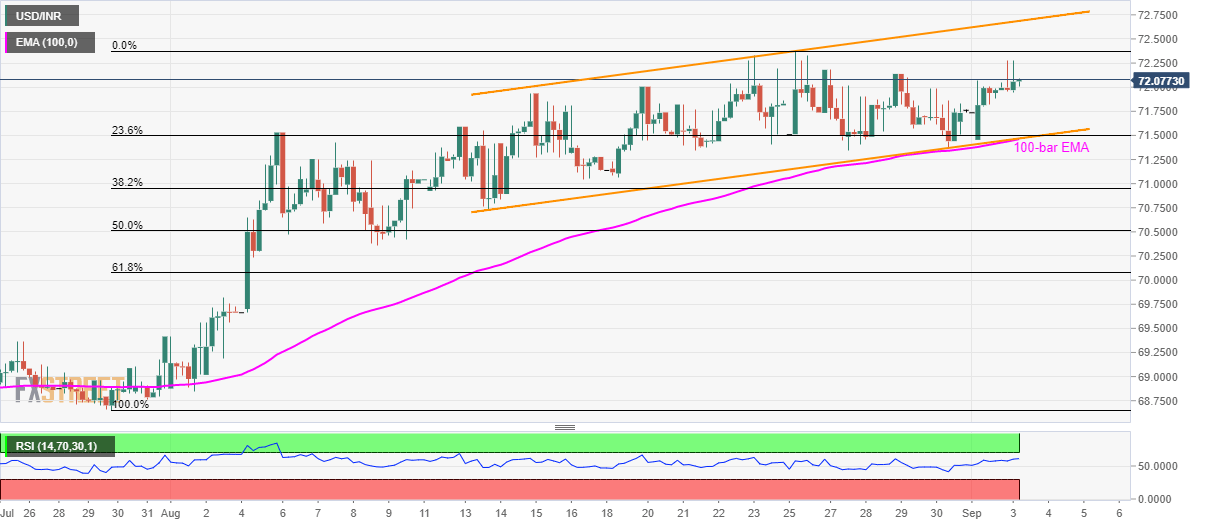
Trend: bullish
