- USD/INR pulls back from 100-day EMA for the second time since late-September.
- A seven-week-old falling trend line limits the pair’s upside.
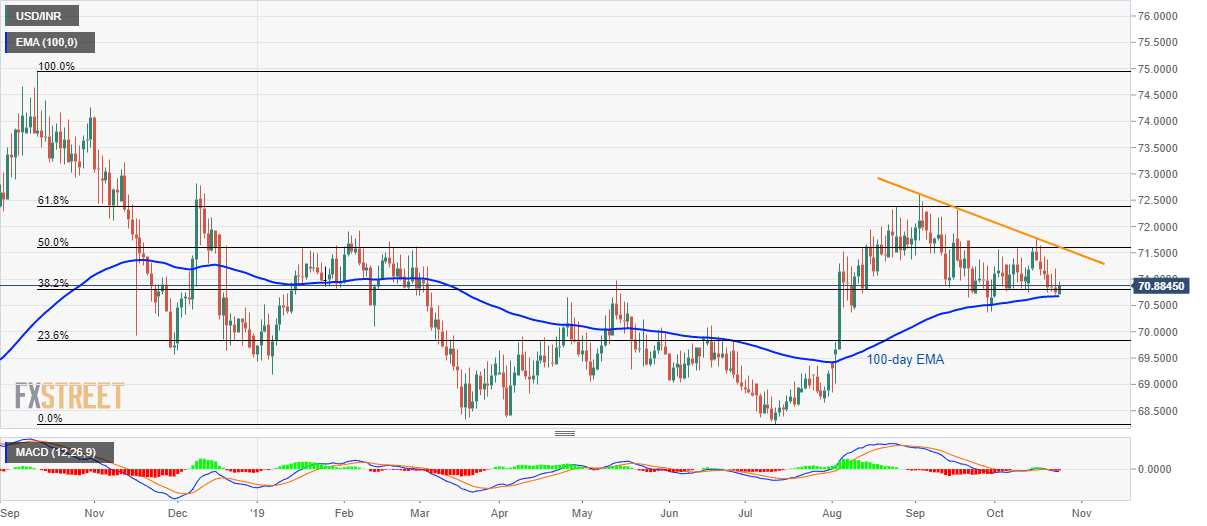
Having registered third U-turn from 100-day EMA, USD/INR takes the bids to 70.87 while heading into the European session on Thursday.
The pair now aims to confront 71.30 immediate resistance. However, a falling trend-line since September-start and 50% Fibonacci retracement of October 2018 to July 2019 downpour, around 71.60/62 could limit the pair’s further upside.
In a case where prices rally beyond 71.62, 61.8% Fibonacci retracement of 72.38 and yearly high close to 72.65 will be on the bulls’ radar.
Alternatively, pair’s declines below 100-day EMA level of 70.67 could trigger fresh downside to June month high near 70.12 ahead of highlighting 70.00 to sellers.
It’s worth mentioning that pair’s south-run past-23.6% Fibonacci retracement, at 69.80, could reprint 69.30 on the chart.
USD/INR daily chart
Trend: pullback expected
