The USD/INR pair managed to avoid a break below 71.00 for two straight days, but the probability of a deeper drop below that psychological level still remains high as the resistance at 71.29 (low of the Thursday’s bearish marubozu candle) is intact.
Daily chart
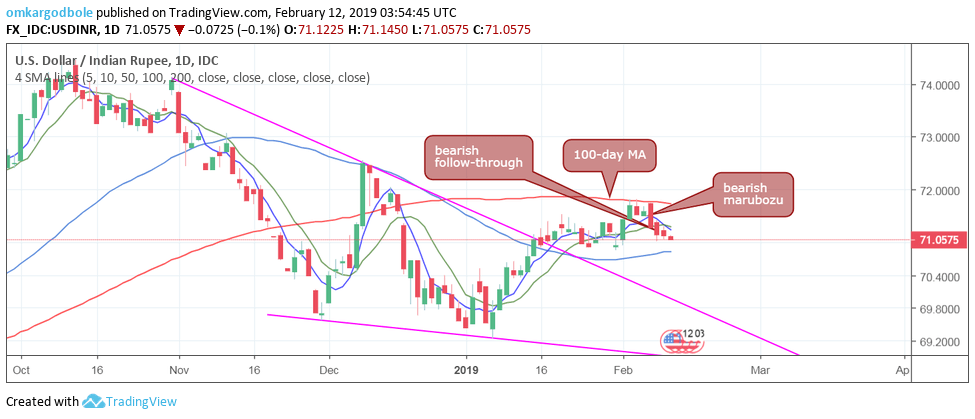
The 5-day moving average (MA) has crossed the 10-day MA from above, reinforcing the bearish view put forward by the bearish marubozu candle carved out last Thursday.
The pair, therefore, risks falling to 70.84 (50-day moving average). A close above 71.29 would invalidate the bearish setup.
4-hour chart
-636855405880973257.png)
The rising wedge breakdown, as seen in the chart above, also supports the bearish view put forward by the daily chart.
Hourly chart
-636855406129103379.png)
The pair may revisit 71.20 if the RSI finds acceptance above the falling trendline. That bounce, however, could be short-lived, courtesy of the bearish setup on the daily chart.
Trend: bearish
