- USD/INR holds on to recovery gains from 50-bar SMA.
- Short-term resistance line, bearish MACD increase odds for another pullback.
- 200-bar SMA, 61.8% Fibonacci retracement provide key support.
While taking rounds to 71.86 during early Asian morning on Wednesday, USD/INR stays below the immediate resistance line amid a bearish signal from MACD.
As a result, sellers can expect another drop to 50-bar Simple Moving Average (SMA) level of 71.72 ahead of dragging the quote to 50% Fibonacci retracement of the current month upside, around 71.40.
However, a confluence of 200-bar SMA and 61.8% Fibonacci retracement near 71.21/18 could restrict pair’s declines below 71.40, if not then November 07 low close to 70.87 and the monthly bottom surrounding 70.50 could be sellers’ favorites.
Should buyers ignore bearish signals from 12-bar Moving Average Convergence and Divergence (MACD), they need to cross immediate resistance line, at 72.13, in order to challenge the monthly top around 72.40.
If at all prices stay strong beyond 72.40, September month high near 72.65 and December 2018 high of 72.82 will be in the spotlight.
USD/INR 4-hour chart
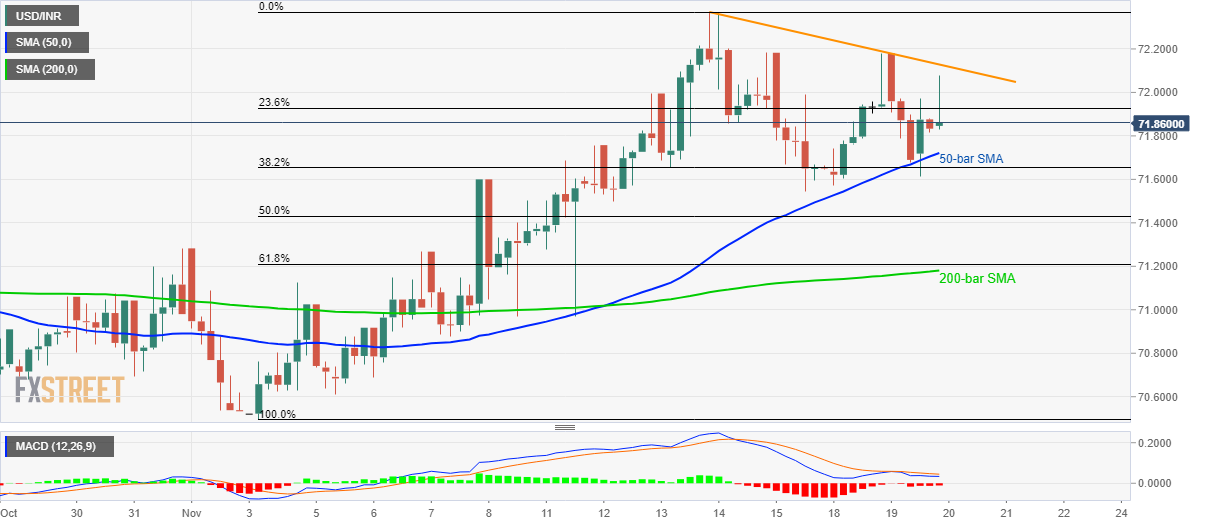
Trend: Pullback expected
