- USD/INR nears 71.45/40 support-confluence amid bearish MACD.
- Repeated failures to rise successfully above 72.00 also portray the momentum weakness.
Despite staying positive around 71.90 ahead of Monday’s European session, the USD/INR seems to have lost upside momentum as not only 12-bar moving average convergence and divergence (MACD) but the inability to successfully trade above 72.00 also portrays the bullish exhaustion.
As a result, sellers await a downside break of 71.45/40 support-confluence including 21-day simple moving average (DMA) and an upward sloping trend-line since August 08.
In doing so, 61.8% Fibonacci retracement of December 2018 to July 2019 downpour, at 71.07 can offer immediate support to the pair whereas 50% Fibonacci retracement level of 70.53 and 200-DMA level of 70.09 can please sellers afterward.
Meanwhile, pair’s sustained trading beyond 72.00 needs to cross a recent high of 72.38 in order to question the December 2018 to surrounding 72.80 and then aim for 73.00 round-figure.
USD/INR daily chart
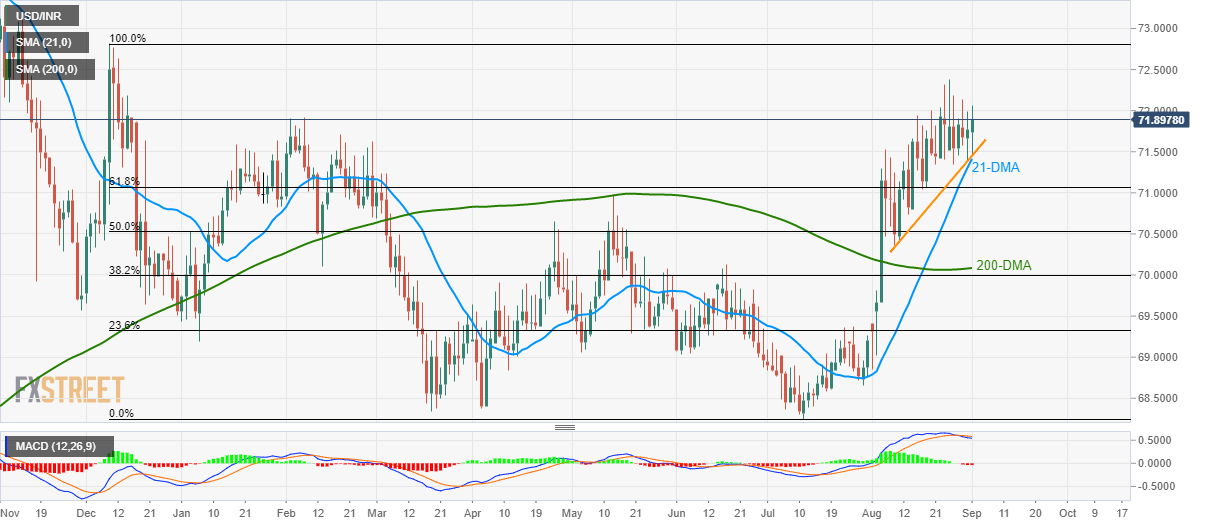
Trend: pullback expected
