- USD/INR weakens amid talks of Indian officials readying measures to boost economic growth.
- 50 and 100-day EMAs join key Fibonacci retracement levels to offer strong downside supports.
Given the Reuters’ report of Indian diplomats preparing for a stimulus, USD/INR flashes a bearish candlestick formation on daily chart while declining to 71.09 ahead of Friday’s European open.
The bearish pattern increases the odds of pair’s drop to 70.95/90 support-confluence including 38.2% Fibonacci retracement of July-September upside and 50-day exponential moving average (EMA), a break of which can push sellers towards another important support joint around 70.45/40 comprising 100-day EMA and 50% Fibonacci retracement.
In a case where the quote keeps trading southwards below 70.40, June month high near 70.10 will lure bears.
On the contrary, an upside clearance of 23.6% Fibonacci retracement, at 71.60, could trigger fresh advances of the pair targeting weekly tops near 72.33 and monthly top nearing 72.63.
USD/INR daily chart
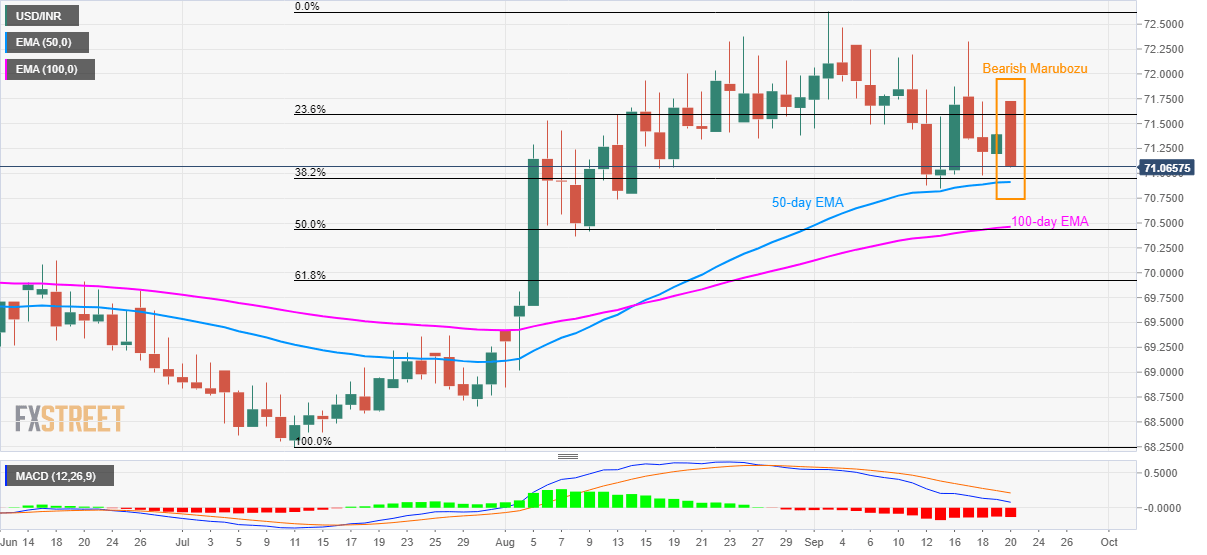
Trend: Further declines expected
