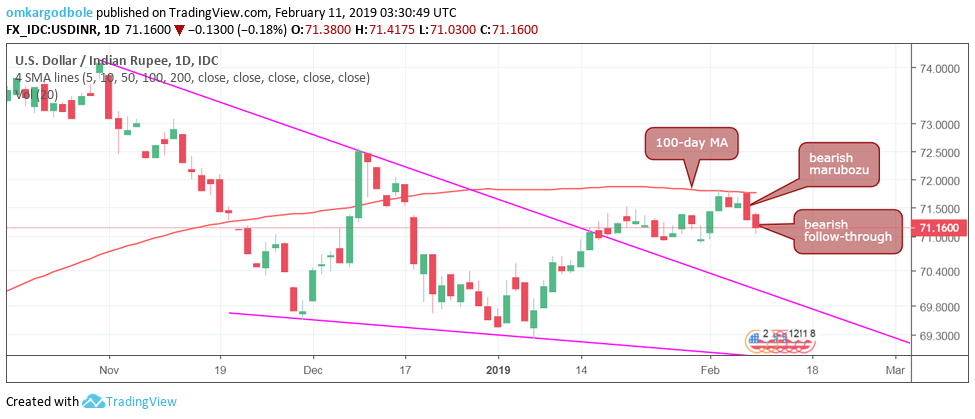
- USD/INR closed well below 71.29 (Thu’s low) on Friday, validating the repeated rejection at the 100-day moving average (MA) hurdle and Thursday’s bearish marubozu candle.
- The pair, therefore, risks falling to 70.86 (Jan. 31 low) this week. A close below that level would only bolster the bearish setup and expose the support lined up at 70.52 (Jan. 3 high).
- Bearish pressures would weaken if the spot finds acceptance above 71.29. The outlook would turn bullish above the 100-day moving average (MA), currently at 71.76.
Daily chart
Trend: bearish
USD/INR
Overview:
Today Last Price: 71.245
Today Daily change: 0.0750 pips
Today Daily change %: 0.11%
Today Daily Open: 71.17
Trends:
Daily SMA20: 71.1902
Daily SMA50: 70.8221
Daily SMA100: 71.7593
Daily SMA200: 70.3975
Levels:
Previous Daily High: 71.59
Previous Daily Low: 71.015
Previous Weekly High: 71.915
Previous Weekly Low: 71.015
Previous Monthly High: 71.64
Previous Monthly Low: 69.185
Daily Fibonacci 38.2%: 71.2346
Daily Fibonacci 61.8%: 71.3704
Daily Pivot Point S1: 70.9267
Daily Pivot Point S2: 70.6833
Daily Pivot Point S3: 70.3517
Daily Pivot Point R1: 71.5017
Daily Pivot Point R2: 71.8333
Daily Pivot Point R3: 72.0767
