- USD/INR sellers await a downside break of short-term key moving average to validate the slip beneath ascending trend-line.
- 69.36/37, comprising latest highs, seem near-term key resistance.
Despite bouncing off 68.63, the USD/INR pair’s pullback is confined by the support-turned-resistance as it trades near 68.9375 heading into the Monday’s European session.
As a result, pair’s fresh declines to recent lows can’t be denied. However, 100-bar moving average on the 4-hour chart (4H 100MA) can limit the pair’s further downside around 68.7610.
Should sellers refrain from respecting 68.7610, 68.3650 and 68.2475 will flash on their radars.
Meanwhile, successful clearance of 68.9542 trend-line resistance can trigger fresh upside towards 69.36/37 area that holds the key to 70.00 round-figure.
USD/INR 4-hour chart
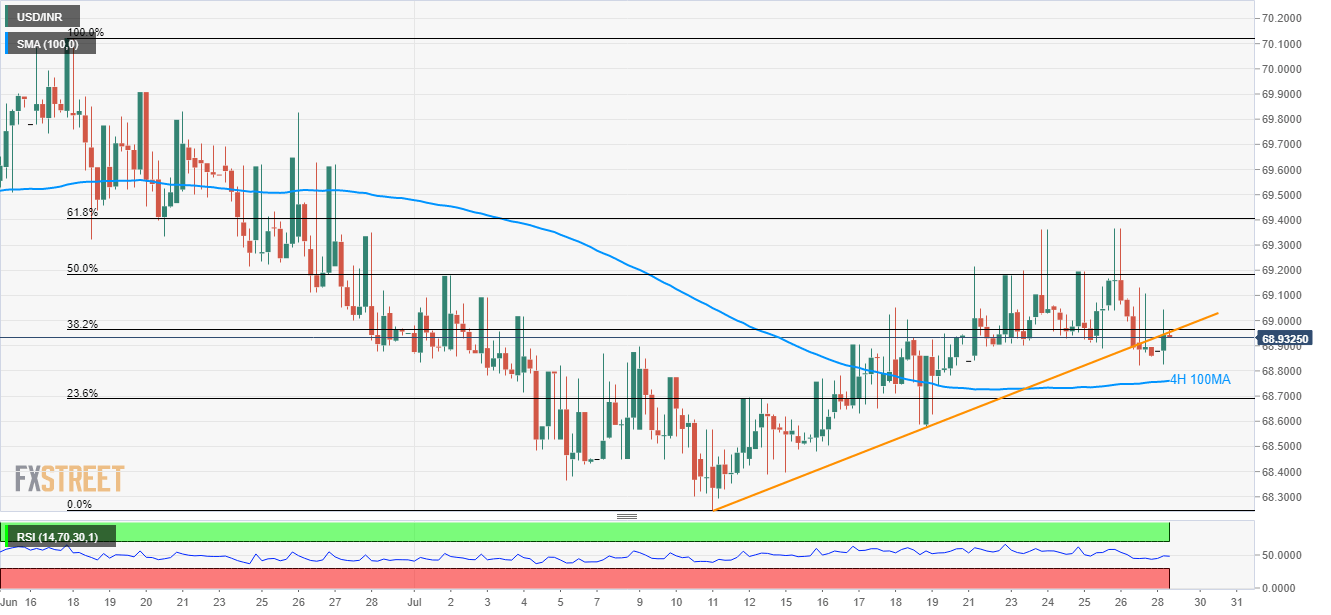
Trend: Pullback expected
