- USD/INR probes the monthly high.
- 23.6% Fibonacci retracement, 50-day SMA act as immediate supports.
- Bullish MACD favors further upside to short-term ascending channel’s resistance.
Not only sustained a break of 50-day SMA but its trading beyond 23.6% Fibonacci retracement also portrays the USD/INR pair’s strength while challenging the monthly top. The quote takes the bids to 71.65 by the press time of pre-European market open on Wednesday.
Bullish signal by 12-bar Moving Average Convergence and Divergence (MACD) favors the pair’s run-up towards a three-week-old rising channel’s resistance line, at 71.96 now.
In a case where prices rally beyond 71.96, also clear 72.00 round-figure, September high near 72.65 can be challenged.
Meanwhile, a downside break of 23.6% Fibonacci retracement of July-September upside, at 71.60, can recall the 50-day Simple Moving Average (SMA) level of 71.35. However, pair’s further declines need to defy the channel formation by slipping below the pattern’s support-line, at 70.80.
With this, the sellers could again attempt to conquer 70.35 rest-point including lows marked during August 08 and September 27.
USD/INR daily chart
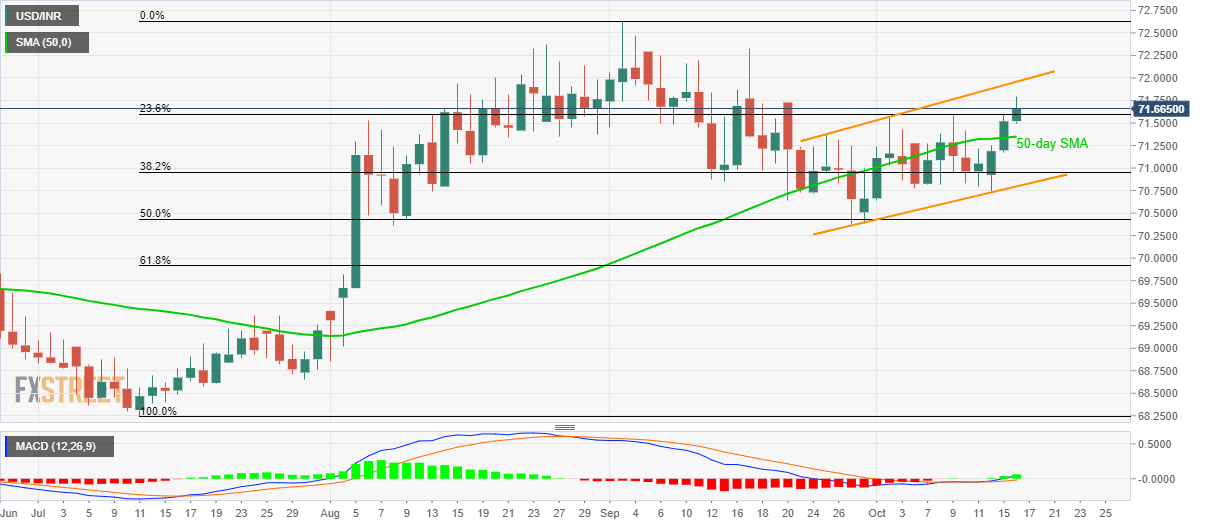
Trend: bullish
