- 100-day EMA caps the USD/INR pair’s rise towards 69.61/62 key resistance confluence.
- 3-week old trend-line can question near-term sellers.
Although Fed-led rally propelled the USD/INR pair to the five-week high during the early Asian session, the quote fails to clear 100-day EMA as it drops to 69.070 ahead of the European open on Thursday.
23.6% Fibonacci retracement of May – July downpour around 68.90 offers immediate support to the pair, a break of which will highlight 3-week old rising trend-line at 68.70.
In a case where prices keep declining past-68.70, bears’ won’t refrain from targeting yearly low around 68.25.
On the contrary, pair’s upside beyond 100-day exponential moving average (EMA) level of 69.42 may find have to clear 69.61/62 resistance confluence including 200-day EMA and 50% Fibonacci retracement in order to justify its strength towards targeting 70.00 round-figure.
USD/INR daily chart
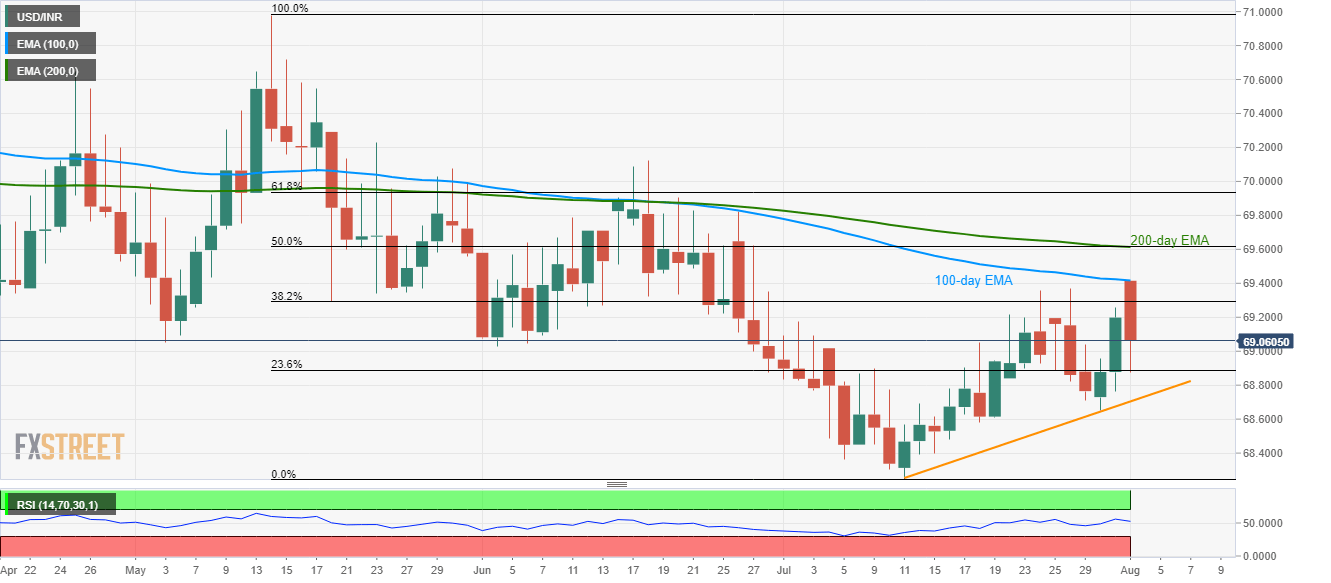
Trend: Pullback expected
