- USD/INR is starting December trading in a tight range.
- The level to beat for bulls is the 71.90 level.
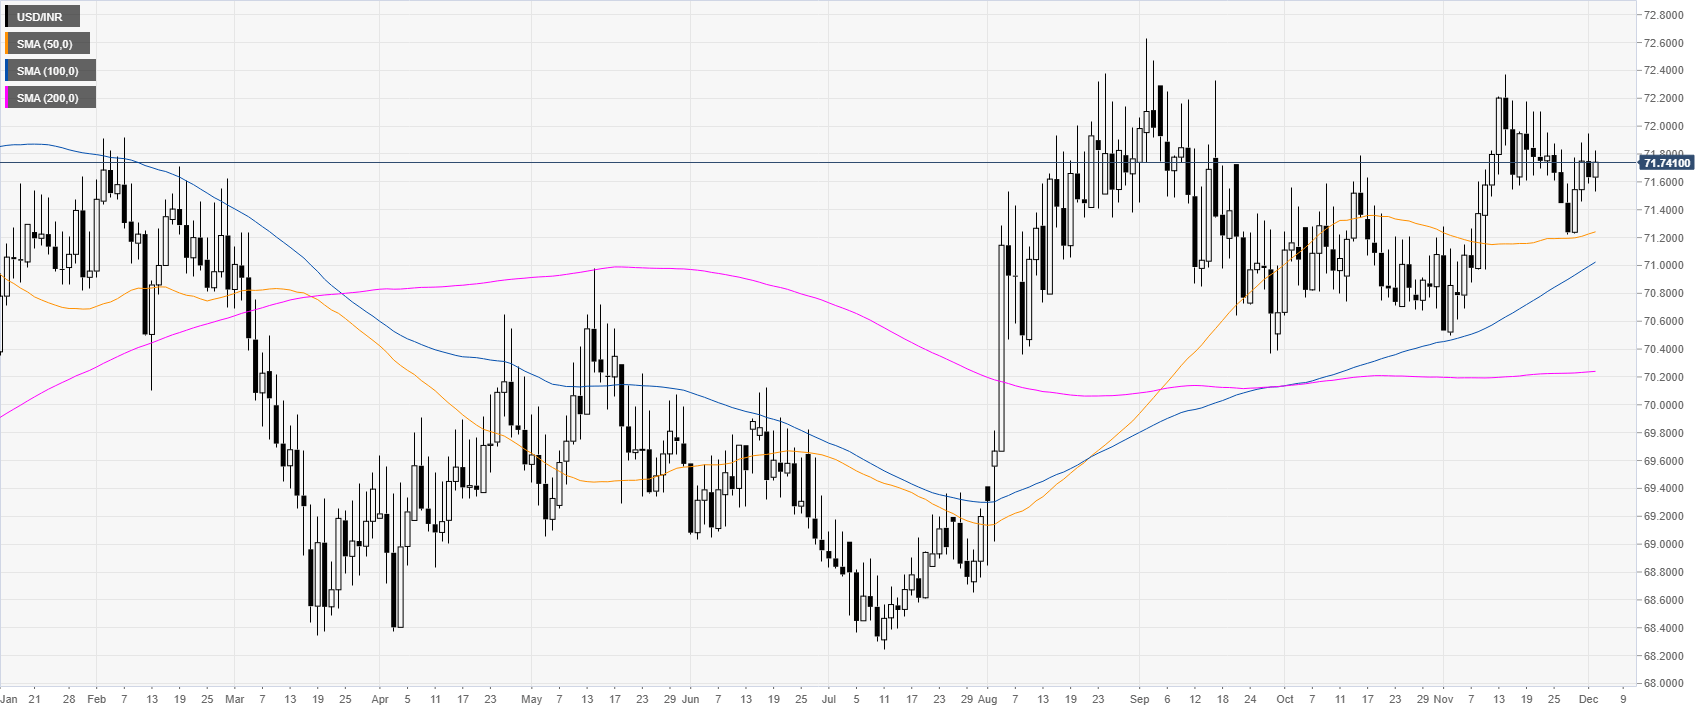
USD/INR daily chart
USD/INR is trading in a bull trend above the main daily simple moving averages (DMAs). The market created a bull flag in November and now the price is consolidating below the 72.00 handle.
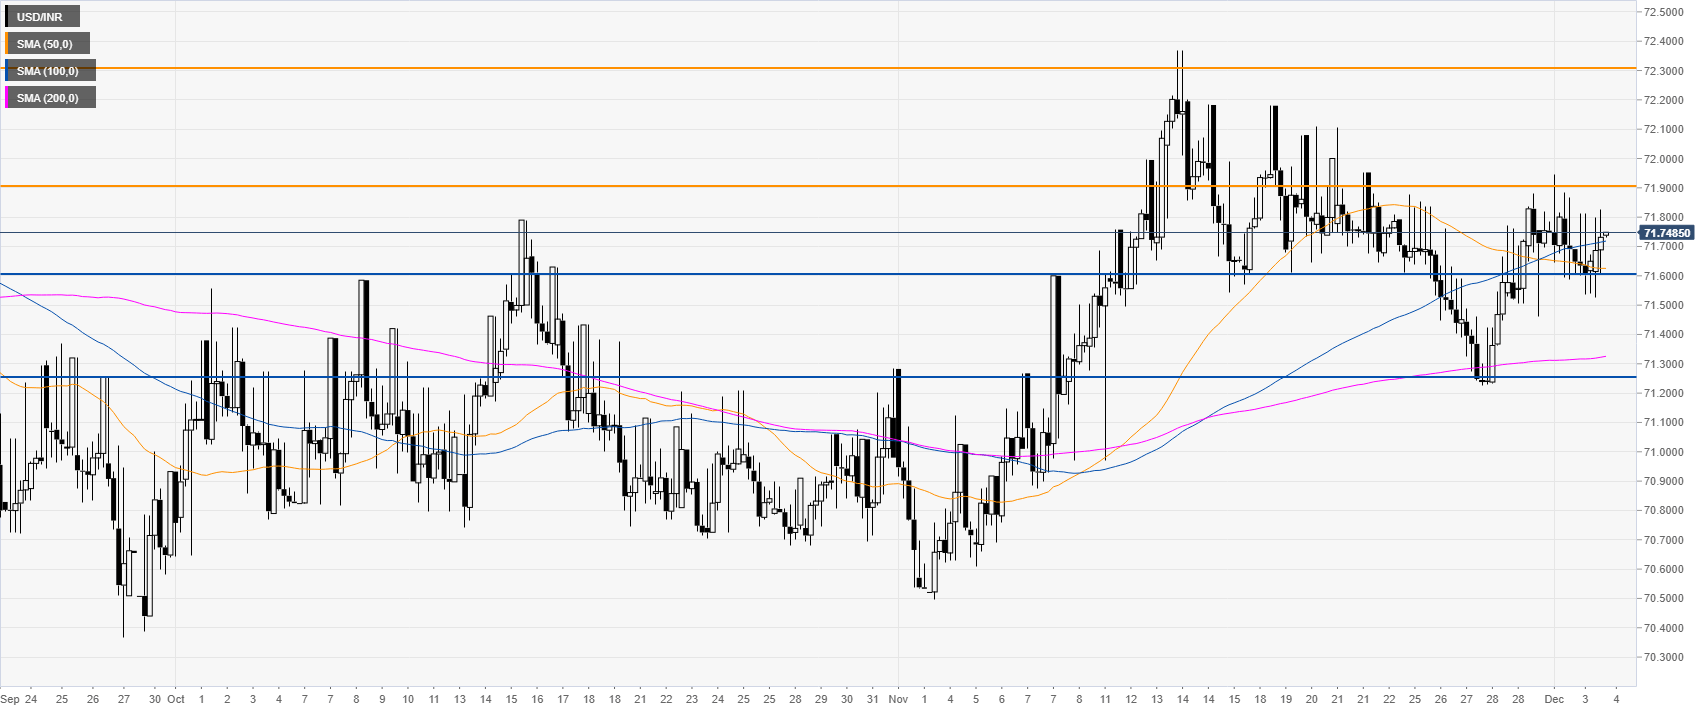
USD/INR four-hour chart
A break above the 71.90 resistance can lead to an acceleration towards the 72.30 level in the medium term. However, a breach below 71.60 on a daily basis can see the currency pair retrace down to the 71.25 support level.
Additional key levels
