- USD/INR nears the lowest in two weeks, trades below 23.6% Fibonacci retracement.
- Bearish MACD emphasizes 70.95/90 support confluence.
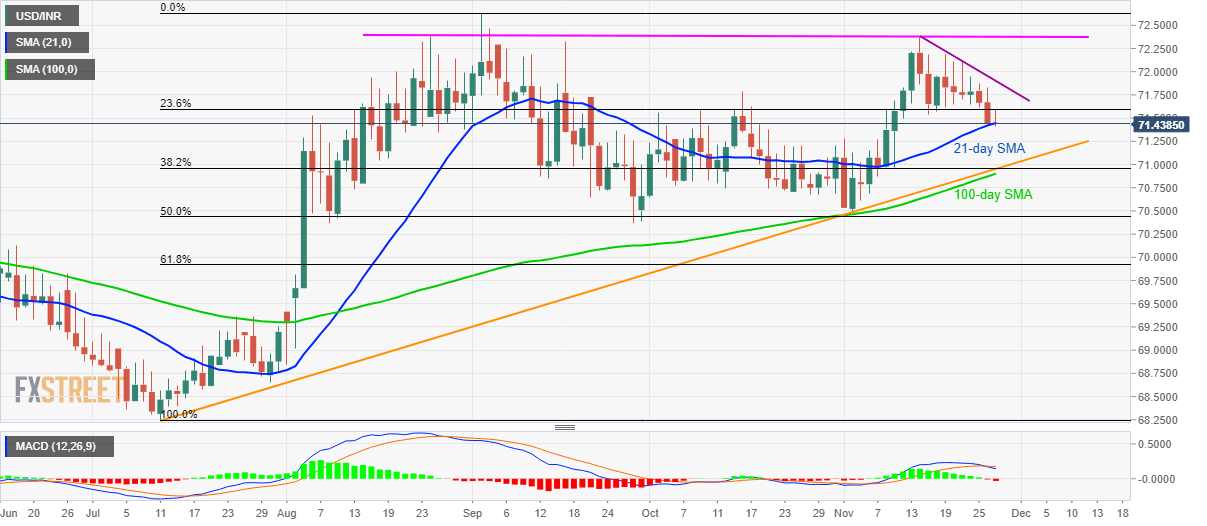
- A three-month-old horizontal line restricts near-term upside.
Following its declines to the lowest in two weeks, USD/INR takes rounds to 71.44 amid Wednesday’s Asian session.
The pair rests on 21-day Simple Moving Average (SMA), at 71.44 now, while also staying below 23.6% Fibonacci retracement of July-September upside, near 71.60.
In addition to the pair’s declines below near-term key Fibonacci retracement, bearish signals from 12-bar Moving Average Convergence and Divergence (MACD) keep the doors open for its further downside.
As a result, the 70.95/90 confluence, including 100-day SMA, 38.2% Fibonacci retracement and an upward sloping trend line since July 11, will gain major market attention. Should prices dip below that support-joint, the monthly low near 70.50 will return to the chart.
On the upside, pair’s sustained break above 71.60 could trigger its short-term recovery towards short-term falling resistance line, at 71.90 now. Though, pair’s run-up beyond 71.90 enables it to challenge 72.37/38 resistance area comprising highs marked in August and November month.
USD/INR daily chart
Trend: Bearish
