- Doji on daily chart indicate reversal of previous declines.
- Upside remains guarded by 100-day and 200-day SMA.
Despite ruling party’s landslide victory in India’s general election, the USD/INR pair refrains from declining much as it flashes 69.72 quote while heading into the European open on Friday.
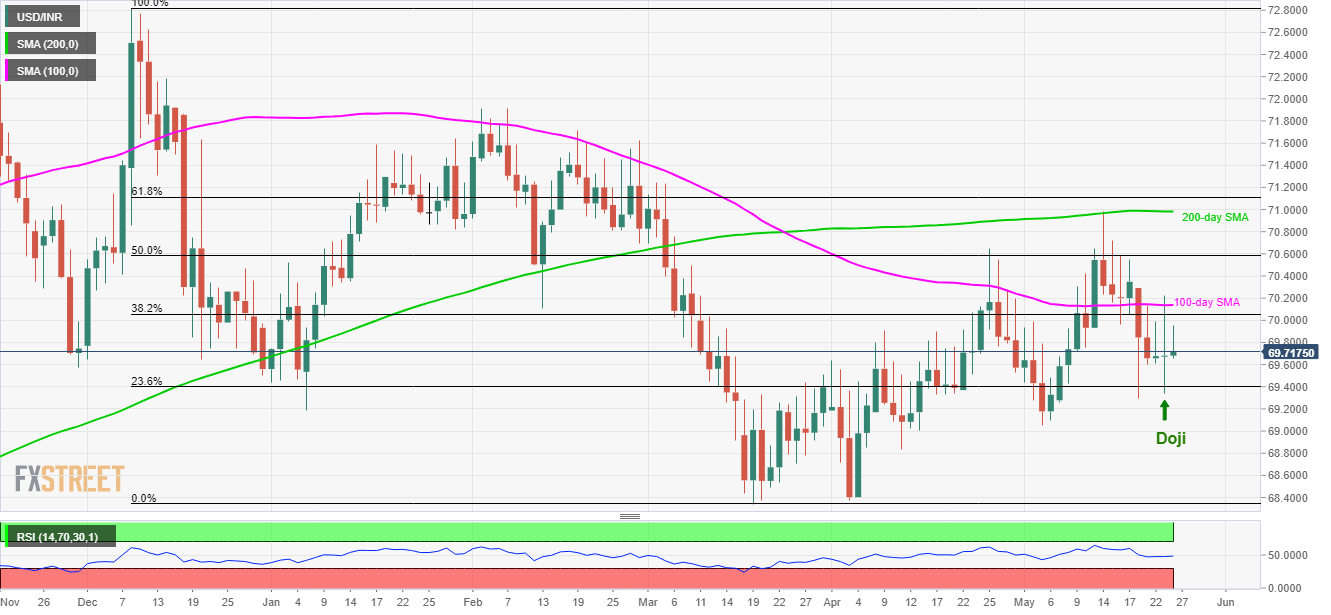
Yesterday’s price momentum portrayed a “Doji” candle on a daily chart signaling the change in trade sentiment from the previous pullback off 200-day simple moving average (SMA).
However, 100-day SMA level of 70.14 and 50% Fibonacci retracement of October 2018 to March 2019 downside, near 70.60, can act as intermediate halts during the rise to 70.85 and then towards 71.00 round-figure around 200-day SMA.
It should also be noted that 61.8% Fibonacci retracement level of 71.15 may question the pair’s upside past-71.00 if not then late-February tops near 71.65 could please buyers.
Meanwhile, 69.30 and current month bottom at 69.05 may limit immediate declines before 68.80.
In a case where prices slide under 68.80, 68.50 and 68.34 might reappear on the chart.
USD/INR daily chart
Trend: Pullback expected
