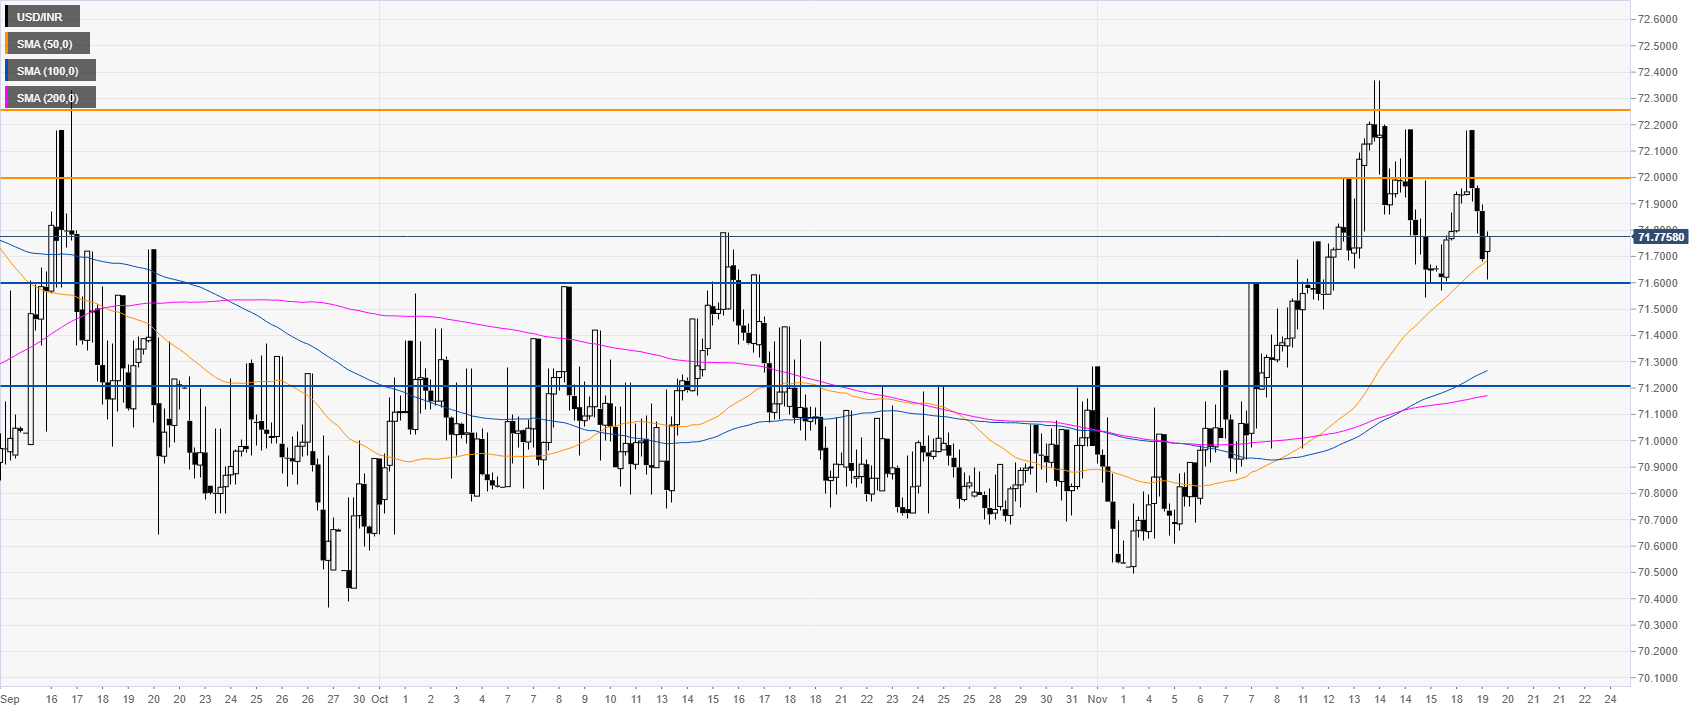
- USD/INR is trading off the daily lows in the New York session.
- The level to beat for bears is the 71.60 level.
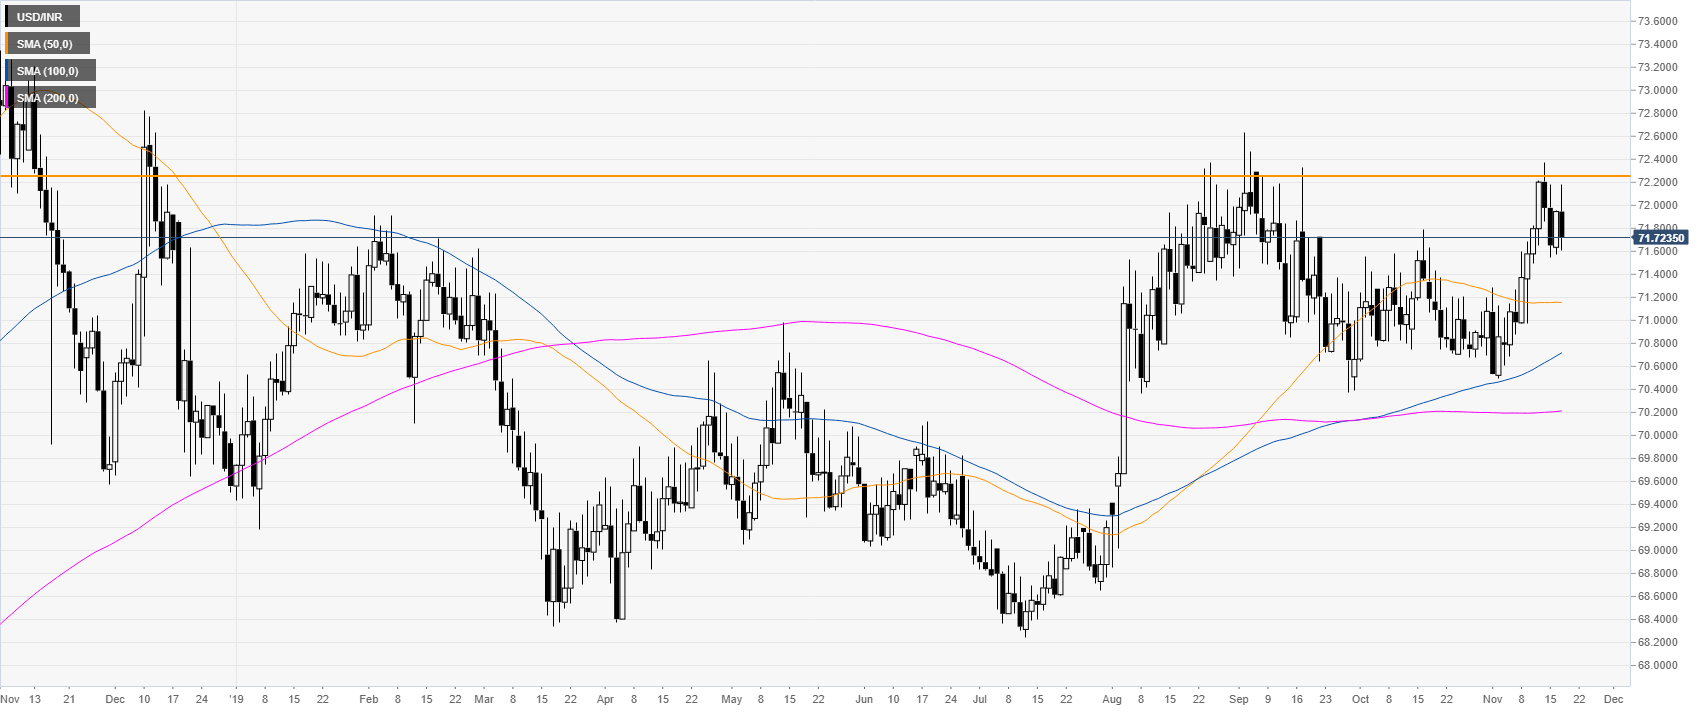
USD/INR daily chart:
USD/INR is trading in a bull trend above its main daily simple moving averages (DMAs). However, the market also created some sort of double top near the 72.25 level.
USD/INR four-hour chart
The market is challenging 71.60 support and the 50 SMA. If the market bounces from here, the spot can revisit the 72.00 handle and possibly the 72.25 resistance if the bulls gather enough steam.
On the flip side, a break below 71.60 can see the market decline and trade towards the 71.20 level.
Additional key levels
