The Indian rupee’s near 90-degree surge continues with the USD/INR pair hitting a 7-month low of 69.10 today. As of writing, the pair is trading at 69.28.
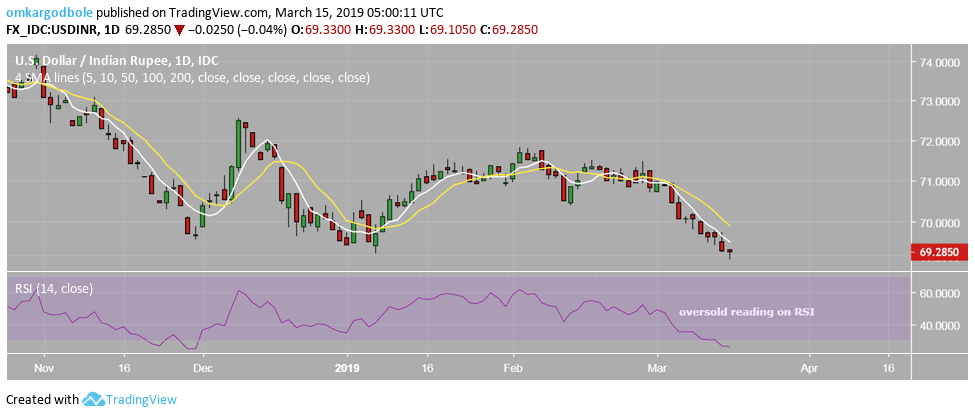
The path of least resistance remains to be the downside, as represented by the downward sloping 5- and 10-day moving averages (MAs) and bearish lower highs and lower lows on the daily chart. What’s more, the spot closed below 69.43 yesterday, invalidating the hammer created on Wednesday.
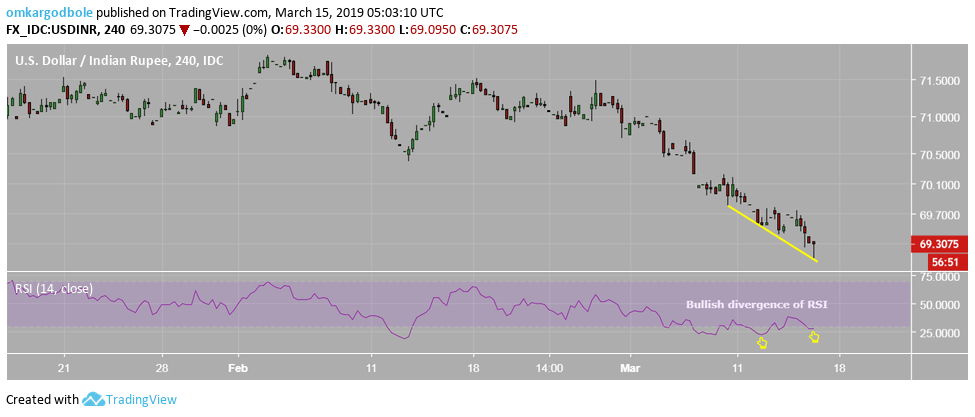
That said, the 14-day relative strength index (RSI) is now reporting oversold conditions with a below-30 print. Add to that the fact that the RSI on the 4-hour chart has again not confirmed the lower low on price chart (bullish divergence continues).
So, a corrective bounce, possibly to the downward sloping 50-hour moving average, currently at 69.65, cannot be ruled out. The probability of an oversold bounce would rise further if the sellers repeatedly fail to keep the pair below the crucial support of 69.2325 (Jan. 7 low).
Daily chart
4-hour chart
Trend: Oversold
