- USD/INR could be in for a minor pullback, having closed above 69.00 for the first time ever.
- The hourly chart shows bearish price RSI divergence.
- Acceptance below 69.00 would validate the preceding doji candle and would allow a minor drop to $68.70.
Hourly chart
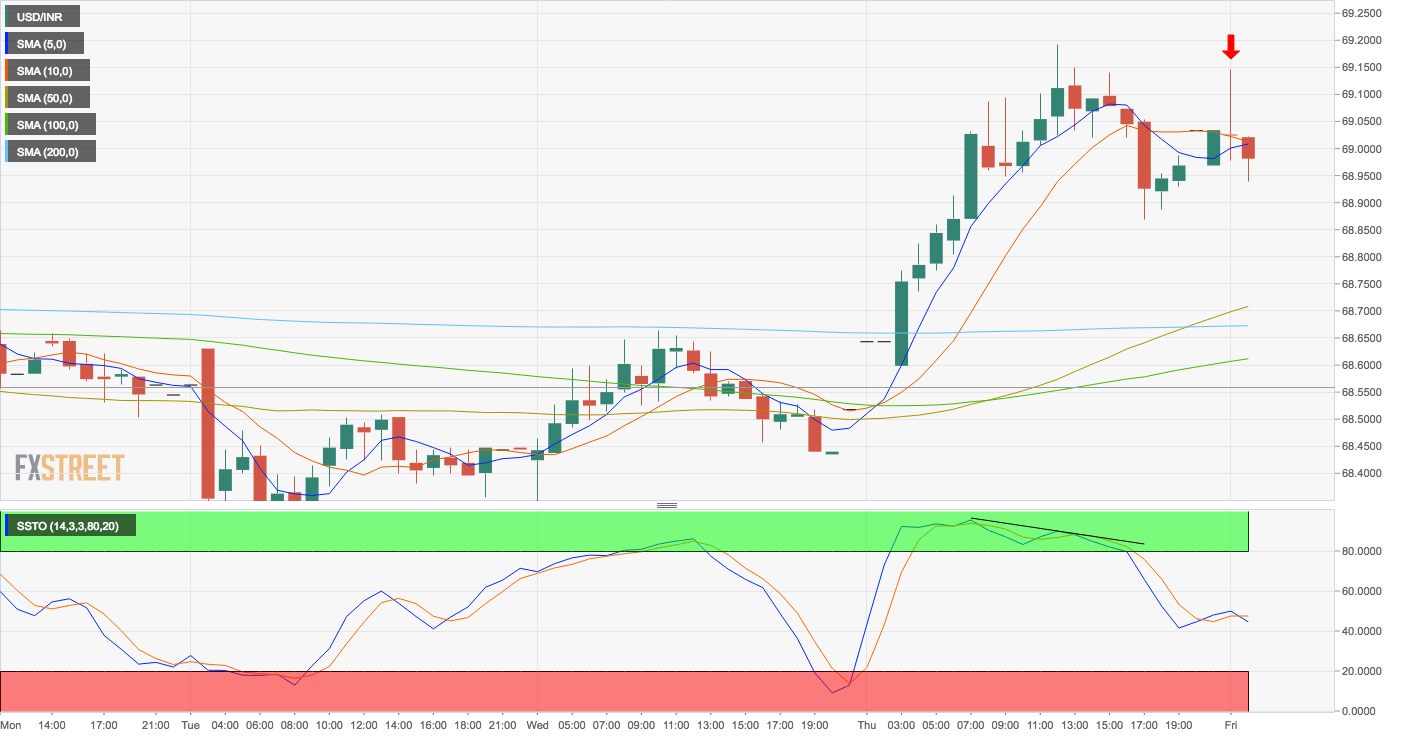
Spot Rate: 69.02
Daily High: 69.04
Daily Low: 68.86
Trend: minor correction likely
R1: 69.18 (record high)
R2: 70.00 (psychological hurdle)
Support
S1: $68.86 (support on hourly chart)
S2: $68.70 (50-hour moving average)
