- The USD-INR pair stalls its recent pullback from two-month tops.
- Regains some traction to snap two straight days of losing streak.
Having defended 38.2% Fibonacci level of the 70.53-72.37 on the daily closing basis, the USD/INR pair managed to regain some positive traction on the first day of a new trading week.
Currently hovering around the 71.60 region, the pair snapped two consecutive days of losing streak and recovered a part of the Friday’s follow-through pullback from two-month tops.
Bulls, however, struggled to build on the move beyond 100-day SMA, which is followed by 23.6% Fibo. level around the 71.95-72.00 region and should now act as a key pivotal point.
Meanwhile, technical indicators on the daily chart maintained their bullish bias and have again started gaining positive momentum on hourly charts, support prospects for further gains.
Hence, some follow-through strength, back towards monthly tops around the 72.35-40 region en-route September monthly peak near the 72.65 region, now looks a distinct possibility.
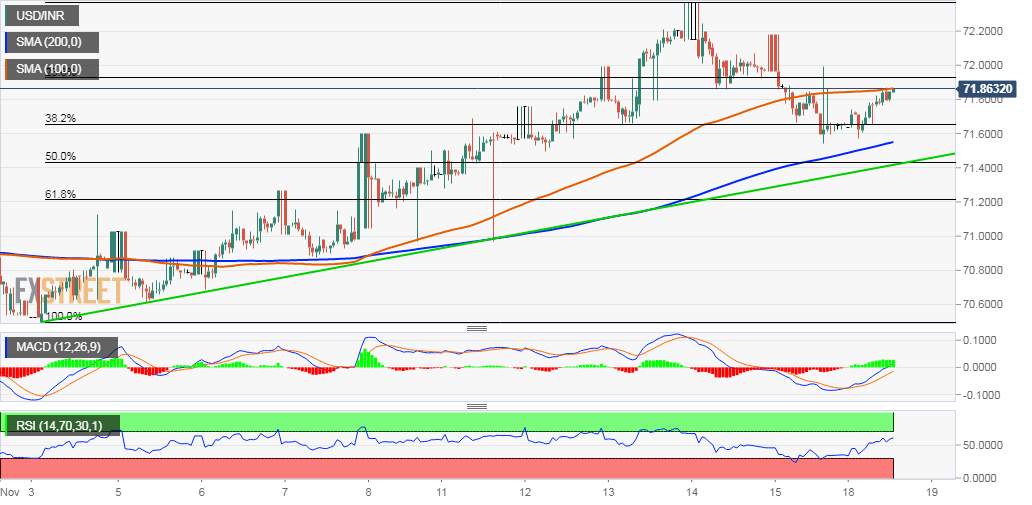
On the flip side, the 71.65-60 region (38.2% Fibo. and also nearing 200-hour SMA) might continue to act as immediate support, which if broken might negate the near-term constructive outlook.
Below the mentioned support, the pair is likely to slide further below 50% Fibo. towards testing the 71.20 confluence support, comprising of 61.8% Fibo. and two-week-old ascending trend-line.
USD/INR 1-hourly chart