- Recent pullback yet to confirm for further upside unless clearing 4H 50/200 MAs.
- 8-week old descending trend-line offers an additional challenge to the buyers.
- RSI still far from the overbought condition.
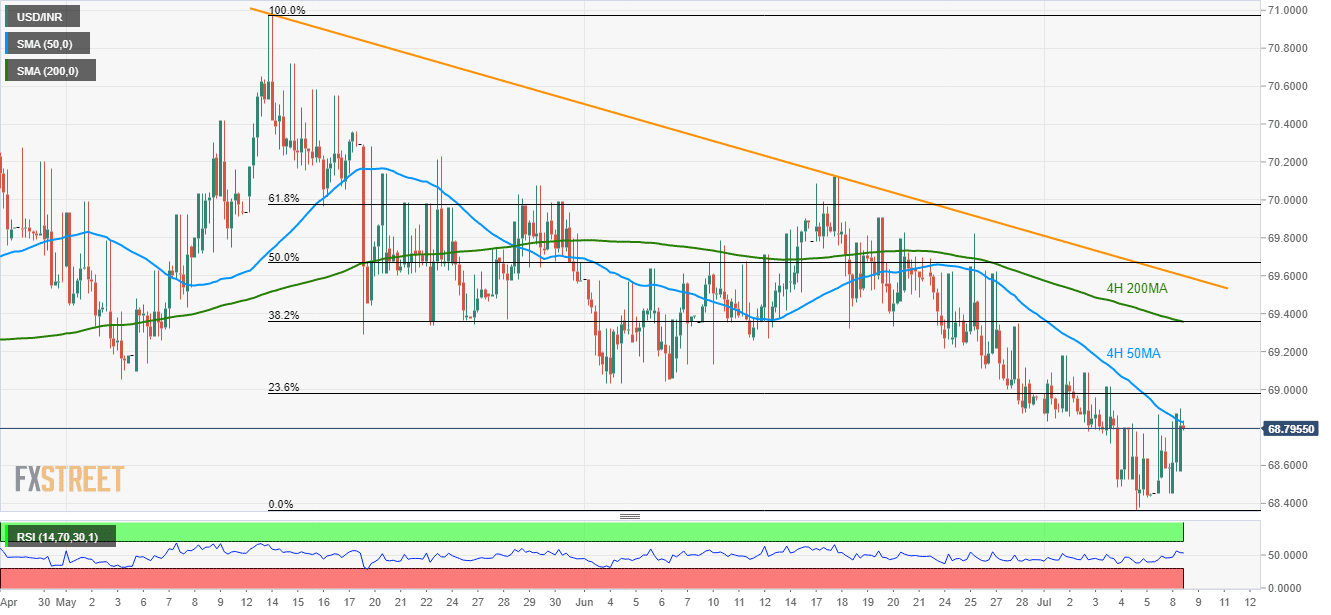
USD/INR recovery is being capped by the 50-bar moving average (4H 50MA) as it trades near 68.7955 while heading into the European open on Tuesday.
A successful break above 68.8262 level comprising 4H 50MA becomes necessary for the quote to aim for early-June lows surrounding 69.05.
However, 69.3565/66 resistance confluence including 38.2% Fibonacci retracement of its May-June declines and 200-bar moving average (4H 200MA), followed by a descending trend-line stretched since mid-May at 69.60 now, could question further upside by the prices.
While the aforementioned resistances challenge the northward momentum, a gradually rising but far from the overbought condition of 14-bar relative strength index (RSI) favors the pair’s near-term advances.
Alternatively, 68.50 can offer immediate support ahead of highlighting the latest low of 68.3650. Further, pair’s additional weakness below 68.36 can please bears with late-2018 bottoms surrounding 68.25 prior to shifting their attention towards 68.00 round-figure.
USD/INR 4-hour chart
Trend: Pullback expected
