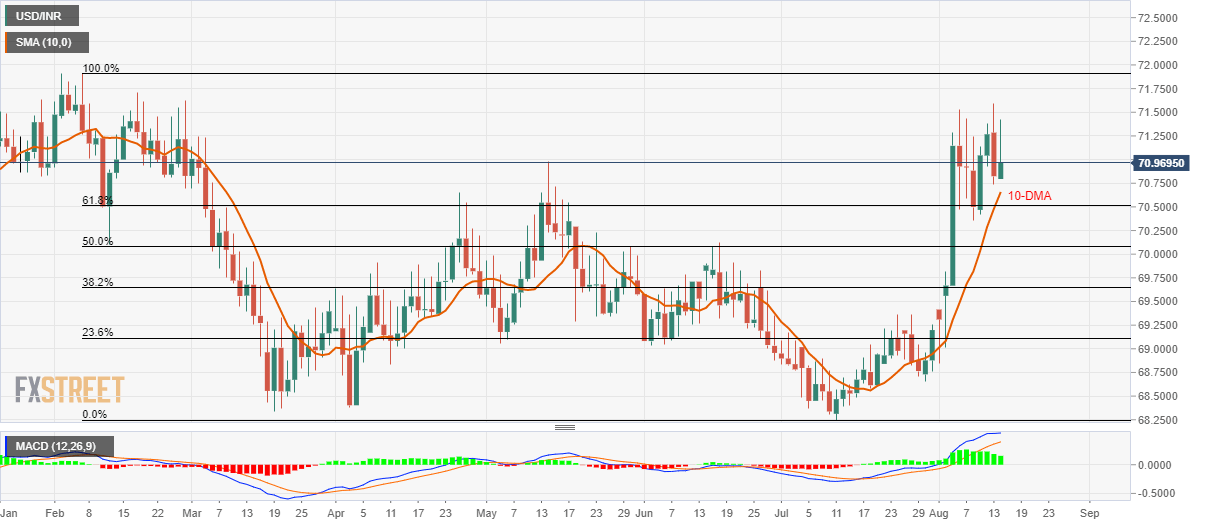
- Failure to rise past-71.60 drags USD/INR downward.
- 10-DMA, 61.8% of Fibonacci retracement seem the key supports.
Despite being on the back foot, USD/INR remains supported by near-term key technical levels as it makes the rounds to 71.00 heading into European session open on Wednesday.
Among the immediate supports, 10-day simple moving average (DMA) level of 70.66 becomes the closest rest ahead of dragging the quote to 61.8% Fibonacci retracement level of February to July downpour, at 70.50.
Should prices slip below 70.50, 50% Fibonacci retracement and June month high can please sellers around 70.12/07.
On the upside, 71.60 holds the gate for the pair’s run-up towards 72.00 round-figure whereas December 2018 high around 72.80 could be next on bears’ watch.
USD/INR daily chart
Trend: Pullback expected

