- USD/INR fails to cross a six-week top ahead of October month Indian trade numbers.
- 50-day SMA can please sellers during further declines.
- An upside break will have multiple challenges for buyers.
Following its failure to remain strong beyond the six-week top, USD/INR trades around 71.70 by the early European session on Friday.
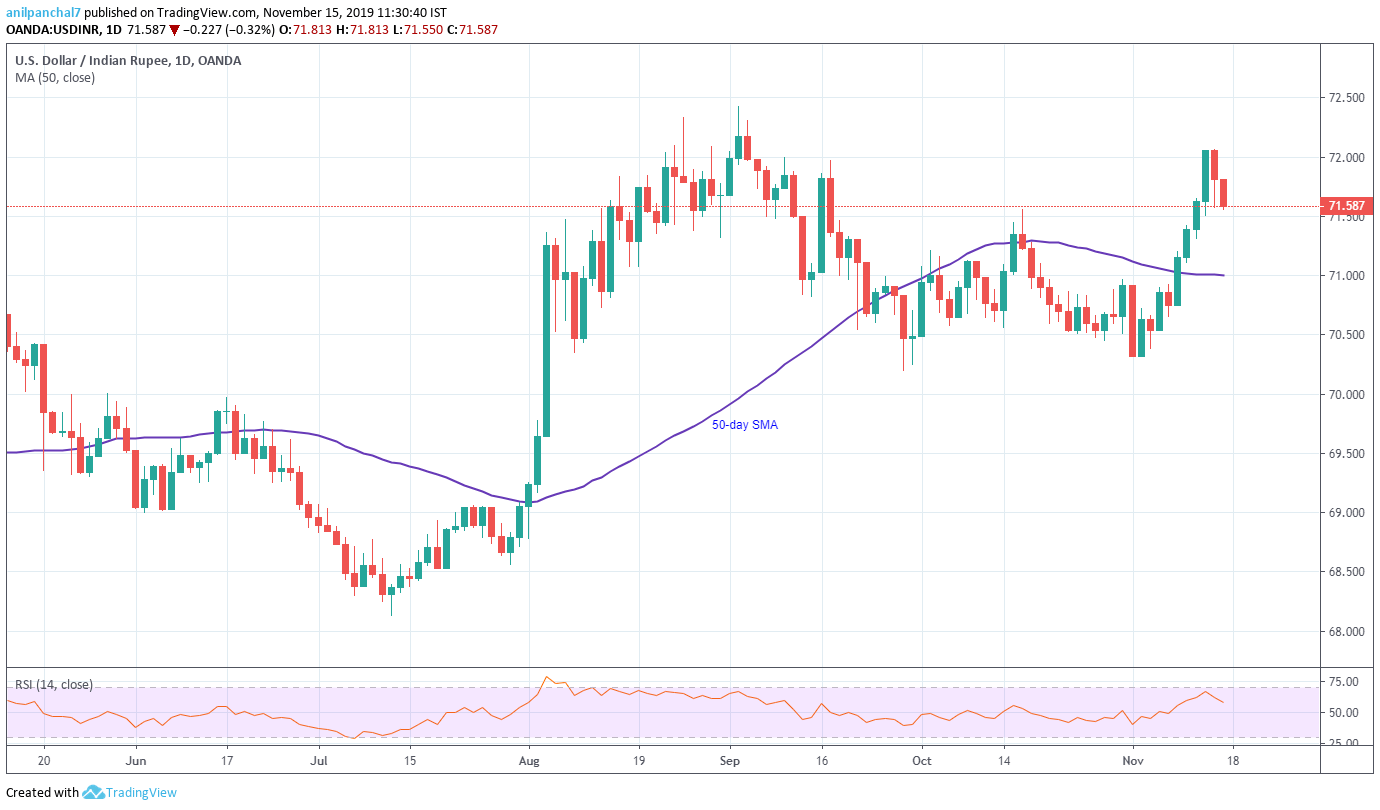
Sellers await entry below October month high, near 71.55, to take aim at 50-day Simple Moving Average (SMA) level of 71.00 and the monthly bottom close to 70.30.
Given the bears’ dominance below 70.30, the 70.00 round-figure will hold the gate to pair’s slump towards late-July highs near 69.10/05.
On the contrary, September month high around 72.65, followed by 73.00 mark, could keep buyers in check amid overbought conditions of 14-day Relative Strength Index (RSI).
On the economic front, October month Trade Balance, prior $-10.86B, from India will be the key to watch.
USD/INR daily chart
Trend: Pullback expected
