- USD/INR crosses 61.8% Fibonacci retracement.
- The quote has been trading between 21-day EMA and short-term falling trend line off-late.
- Upbeat RSI portrays underlying momentum strength.
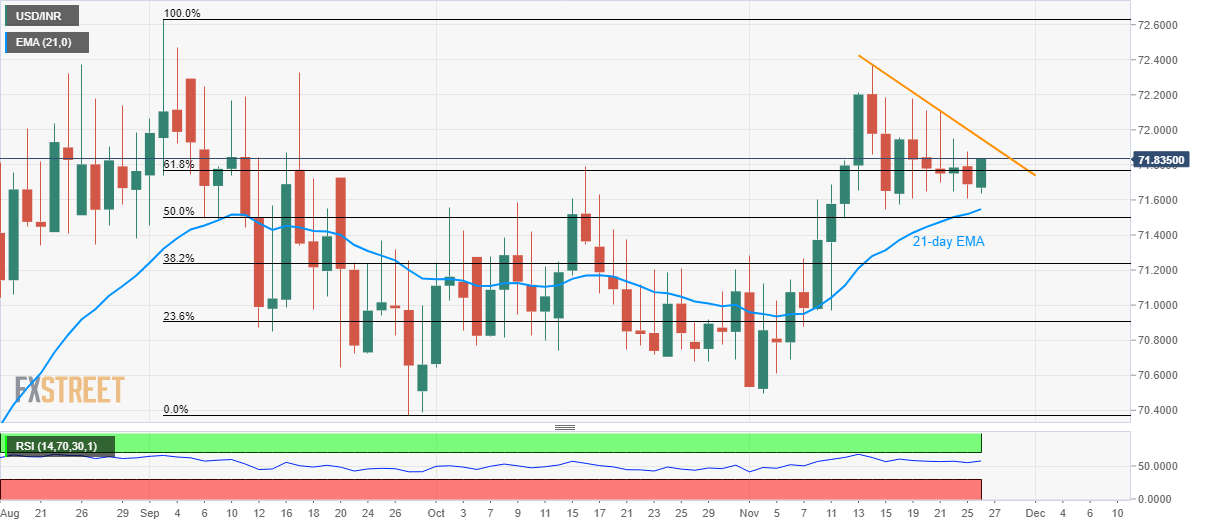
USD/INR takes the bids to 71.84, also crosses 61.8% Fibonacci retracement of September month downpour, during early Tuesday’s Asian session. Even so, the quote stays between an eight-day-old falling resistance line and a 21-day Exponential Moving Average (EMA).
However, upbeat conditions of the 14-bar Relative Strength Index (RSI) indicate the underlying strength of the momentum, which in turn increases the odds of pair’s rise to monthly top near 72.37 on the break of 71.95 trend line resistance.
It should also be noted that the September month top near 72.65 and 73.00 round figure will be on the buyers’ radar during the additional run-up.
On the contrary, pair’s daily closing below 21-day EMA level of 71.55 can fetch the quote to month-start top close to 71.28.
Further, the pair’s extended declines below 71.28 might not refrain from dragging it to the monthly low near 70.50 ahead of highlighting 70.00 psychological magnets.
USD/INR daily chart
Trend: Sideways
