- USD/INR stays below 23.6% Fibonacci retracement amid near overbought RSI levels.
- A weekly break below 71.45 could recall May month top.
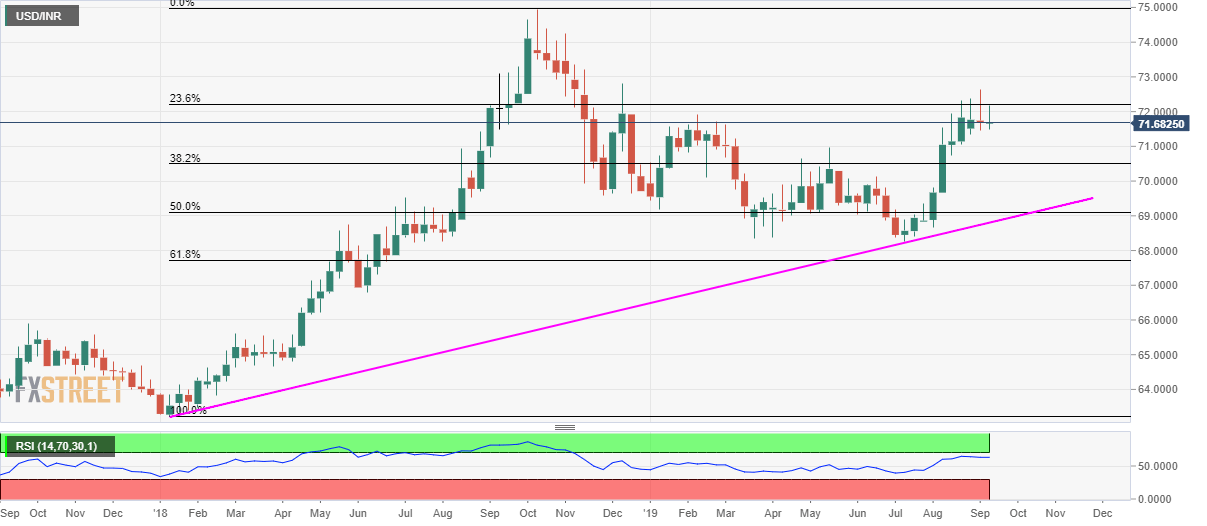
Repeated failures to cross 23.6% Fibonacci retracement of the year 2018 upside portray the USD/INR pair’s weakness as it trades near 71.7250 ahead of the European session on Wednesday.
In order to revisit May month high surrounding 71.00, a weekly closing below previous candle low of 71.45 becomes necessary while 38.2% Fibonacci retracement level of 70.50 and June month high close to 70.12, followed by 70.00 round-figure, could please bears afterward.
It should, however, be noted, that the pair’s declines below 70.00 will find it hard to sustain as 50% Fibonacci retracement level of 69.10 and 21-month-old rising trend-line near 68.80 will question pair’s further south-run.
Alternatively, pair’s weekly close above 23.6% Fibonacci retracement level of 72.20 could challenge December 2018 high of 72.82 while 73.15/20 area, including mid-October 2018 lows, holds the key to pair’s rally towards 75.00 mark.
USD/INR weekly chart
Trend: pullback expected
