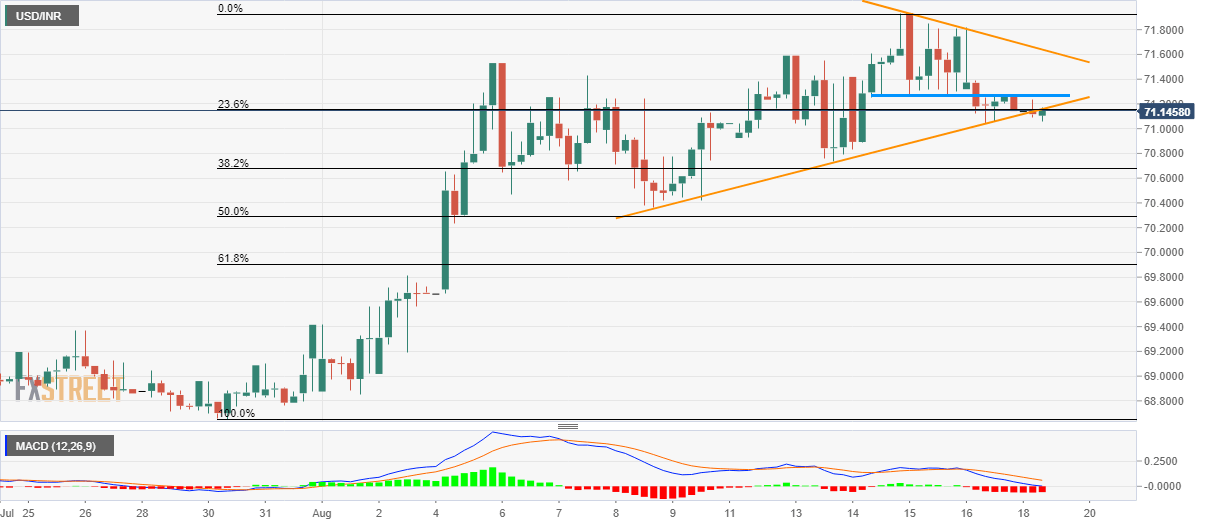
- USD/INR remains below short-term support-line.
- The three-day-old horizontal resistance limits the immediate upside.
- 38.2% Fibonacci retracement can lure sellers.
Having breached a 12-day old support-line, the USD/INR pair takes the rounds to 71.16 ahead of Monday’s European session.
Not only pair’s decline below ascending trend-line but sustained trading below three-day-old horizontal-area also increases the odds for its declines to 38.2% Fibonacci retracement level of July-end to mid-August upside at 70.68.
During the quote’s extended south-run below 70.68, 50% Fibonacci retracement near 70.30 and 70.00 round-figure will lure bears.
Meanwhile, pair’s pullback needs to cross 71.25/28 horizontal resistance in order to target immediate descending trend-line at 71.65, a break of which can propel prices to monthly top surrounding 71.94.
It should also be noted that 12-bar moving average convergence and divergence (MACD) flashes bearish signal.
USD/INR 4-hour chart
Trend: Pullback expected

