- USD/INR stays choppy inside a short-term bearish technical pattern.
- RSI also seesaws amid a normal range, signaling gradual weakness.
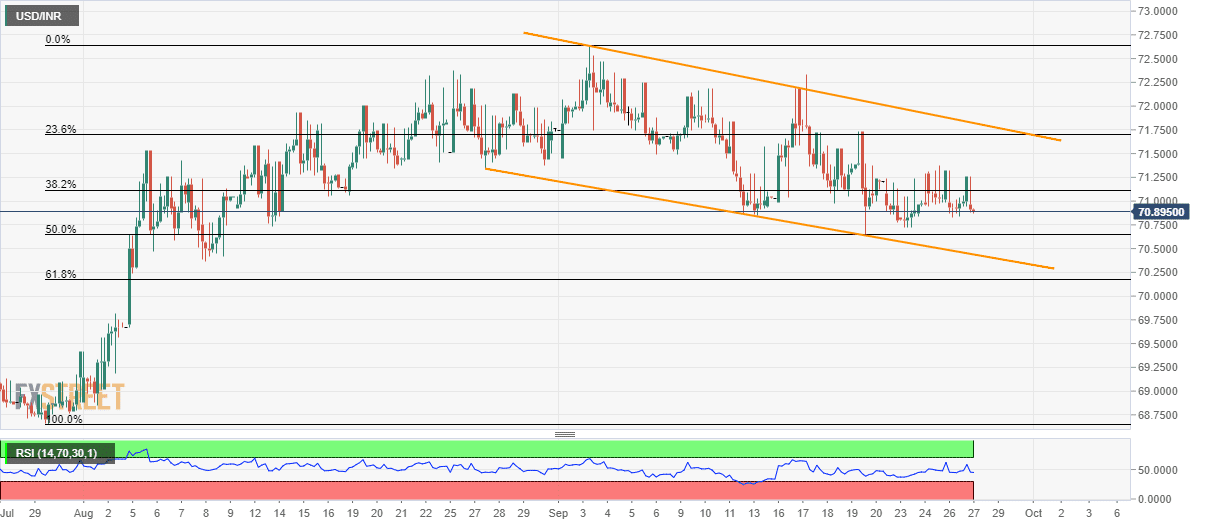
While a four-week-old falling channel portrays the USD/INR pair’s gradual weakness, prices stay sidelined around 70.90 by the press time of pre-European session open on Friday.
Also showing the lack of momentum is the 14-bar relative strength index (RSI) that seesaws near a normal range, indicating gradually declines to 50% Fibonacci retracement level of July-September upside, at 70.65.
However, pair’s further declines will be stopped by the channel-support, at 70.44, which if ignored could drag the quote to sub-70.00 area.
Alternatively, 71.40 can offer immediate resistance ahead of highlighting 71.70/83 area including 23.6% Fibonacci retracement and channel resistance.
Should there be additional upside beyond 71.83, buyers could challenge monthly top surrounding 72.65.
USD/INR 4-hour chart
Trend: bearish
