- Repeated retracements from the breakout portray USD/INR weakness.
- 3-week old support-line acts as immediate rest.
- 70.00 and 200-DMA seem key resistances.
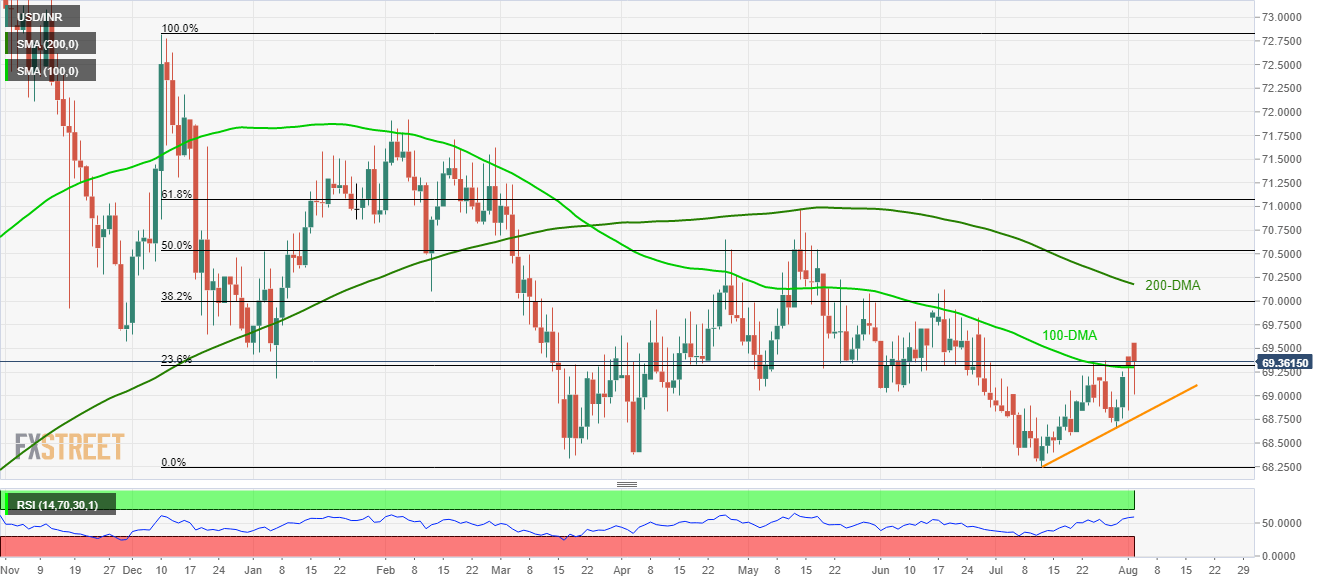
Failure to rise successfully beyond 69.30/32 confluence, drags the USD/INR pair down to 69.34 ahead of the European open on Friday.
However, a closing break below the 100-day moving average (DMA) and 23.6% Fibonacci retracement of December 2018 to July 2019 confluence becomes necessary for the quote to drop towards near-term support-line around 68.76.
It should also be noted that the price drop under 68.76 might not refrain from flashing July low, at 68.25, back to the chart.
On the upside, 69.80 and 38.2% Fibonacci retracement level around 70.00 seem strong resistances to watch ahead of observing 200-DMA level of 70.18.
USD/INR daily chart
Trend: Pullback expected
