- USD/INR trails below an ascending trend-line stretched since August 05.
- 4H 50MA, 50% Fibonacci retracement becomes near-term key supports.
Despite taking the bids near 72.06 ahead of Monday’s European open, USD/INR still lags behind a three-week-old resistance-line.
With the repeated failures to cross the ascending trend-line since August 05, the quote is more likely to visit 100-bar moving average on the four-hour chart (4H 100MA) at 71.20.
Should prices keep trading southwards below 71.20, 50% Fibonacci retracement level of the upside since early July, at 70.30, followed by 70.00 round-figure gain sellers’ attention.
Alternatively, a successful break of the aforementioned trend-line at 72.40 opens the door for the pair’s run-up towards December 2018 high of 72.82 and then to 73.00 round-figure.
USD/INR 4-hour chart
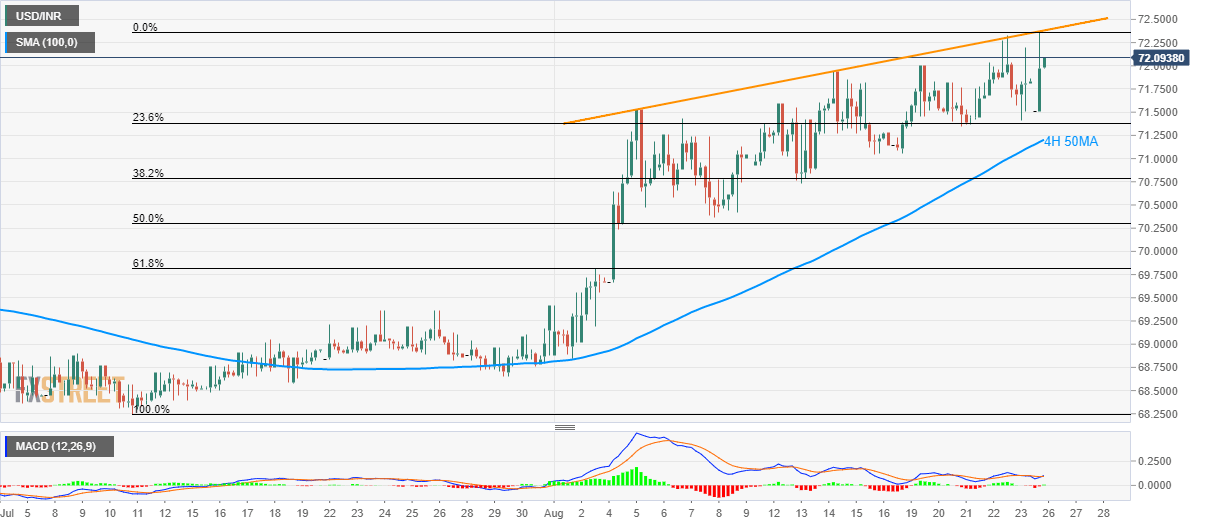
Trend: Pullback expected
